Zero-click content distribution: how to reach buyers who never click
A map of the channels where B2B buyers read about you without visiting your site, a native-first way to package each piece, a four-week plan a small team can run, and a way to measure the attention that never becomes a click.
43 min readWritten by Ampere
Short answer
What is zero-click marketing?
Zero-click marketing is the practice of putting the useful part of your content on the surfaces where buyers already read, listen, and ask questions, such as social feeds, podcasts, newsletters, communities, and AI answers, so it works even when nobody visits your website. Success is measured by asking buyers how they heard about you and by signals such as branded search, not by clicks alone.
Summary
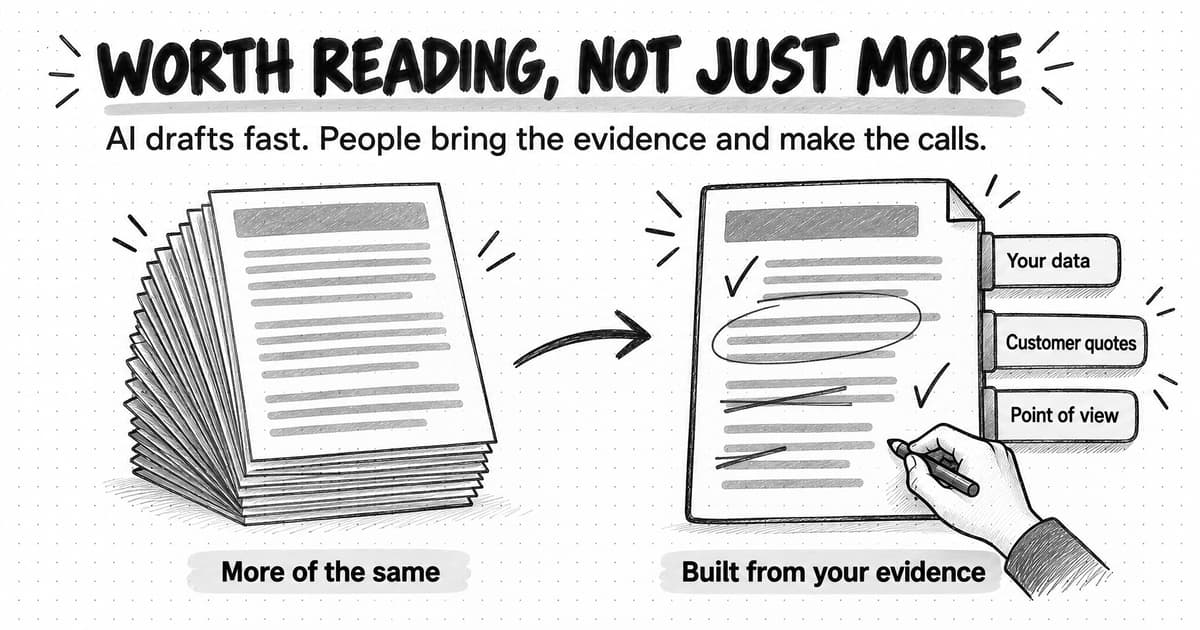
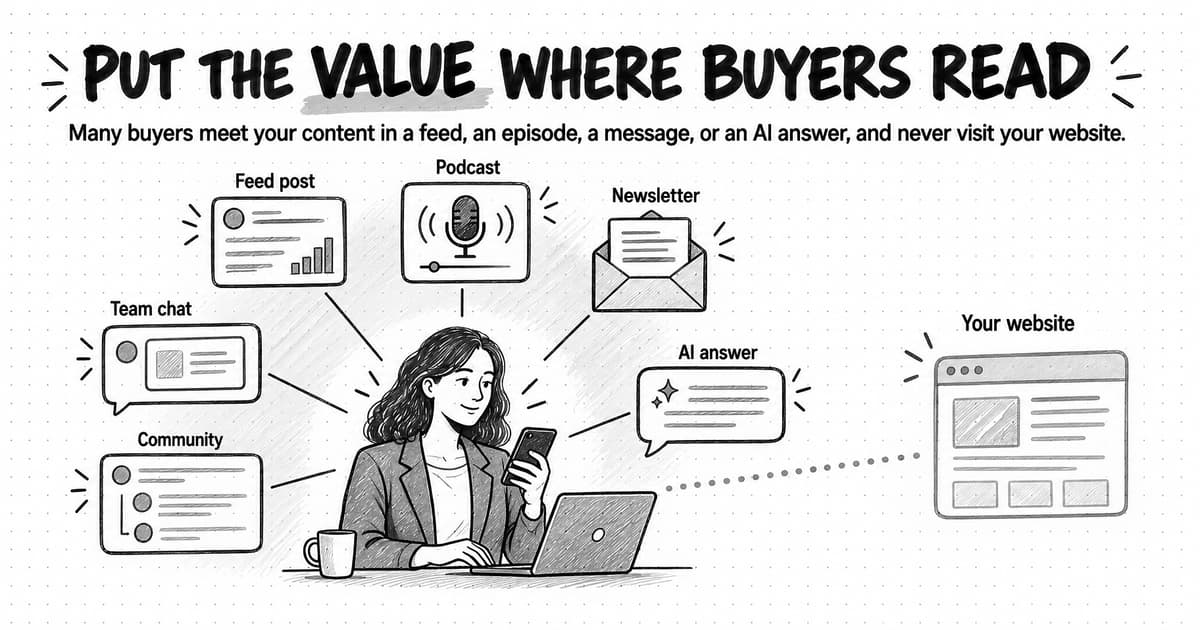
Many B2B buyers now meet a company's content without clicking: in a feed, an episode, a newsletter, a colleague's message, or an AI answer. Zero-click content distribution plans for that. Each channel gets a native version that delivers the useful part where the buyer already is, names who said it, and offers a link only as an extra for readers who want the full method or data.
The click data comes from studies with different methods, so read each on its own terms. Pew's March 2025 browsing panel found users clicked a traditional Google result in 8% of visits when an AI summary appeared, against 15% without one, and a link inside the summary in about 1%. Studies from SparkToro, Ahrefs, and Seer point the same way; Google says total clicks are relatively stable.
A distribution map groups channels as owned, rented, borrowed, earned, and AI answers. Small teams tend to overinvest in their blog and company page and neglect borrowed audiences such as podcasts, newsletters, and partners, which offer trust someone else has built. Syndicated copies should carry a noindex tag, per Google's guidance, and community work should start with reading the rules and answering questions as a person.
Separate platform statements from folklore. LinkedIn states no link penalty, but Socialinsider's benchmark of 16,645 business pages, published in March 2026, found link posts had the lowest engagement rate in 2025. X's owner said in 2023 that its ranking favors time spent on X, then said in 2026 that link posts were no longer penalized, without publishing data. Meta tested link-post limits for some Pages in late 2025. Test link placement on your own account.
Measure content that isn't clicked by asking buyers how they heard about you, in an open text field and on sales calls, and coding the answers monthly by channel group. Alongside that, watch branded search, direct visits to deep pages, the quality of native engagement, and content mentioned in sales conversations. A lean team can run one substantial piece a month through a four-week plan and review it in 30 minutes.
Contents
- What zero-click content distribution means
- How much search stopped sending clicks, by study
- Where B2B buyers find content now
- The content distribution map: owned, rented, borrowed, earned and AI answers
- Native content: put the value where the reader already is
- What platforms say about link posts
- Dark social: the sharing your analytics can't see
- Borrowed audiences: podcasts, newsletters, partners and syndication
- Communities and earned media
- AI answers as a distribution channel
- A distribution plan a lean team can run
- How to measure content that doesn't get clicked
- Worked example: one research finding, distributed for a month
- Common content distribution mistakes
- Content distribution with Ampere
- Sources and further reading
- Frequently Asked Questions
What zero-click content distribution means
If you run content for a B2B company, you may know this pattern: organic traffic to the blog is down, newsletter clicks are flat, and yet new buyers on sales calls say they have been following the company for months. They saw the founder's posts, heard someone from the team on a podcast, read a summary in an AI answer, or had a colleague forward a screenshot. The content reached them. The analytics never saw it.
Zero-click content distribution is the practice of getting the useful part of your content in front of buyers on the surfaces where they already read, listen, and ask questions, so that it works even when nobody visits your website. The term borrows from "zero-click search", which describes a search that ends without a click to any result. In content, zero-click is a broader condition: a LinkedIn post that teaches the whole idea in the feed, a podcast interview, a newsletter feature, a community answer, and an AI answer that cites your research can all influence a buyer who never clicks anything.
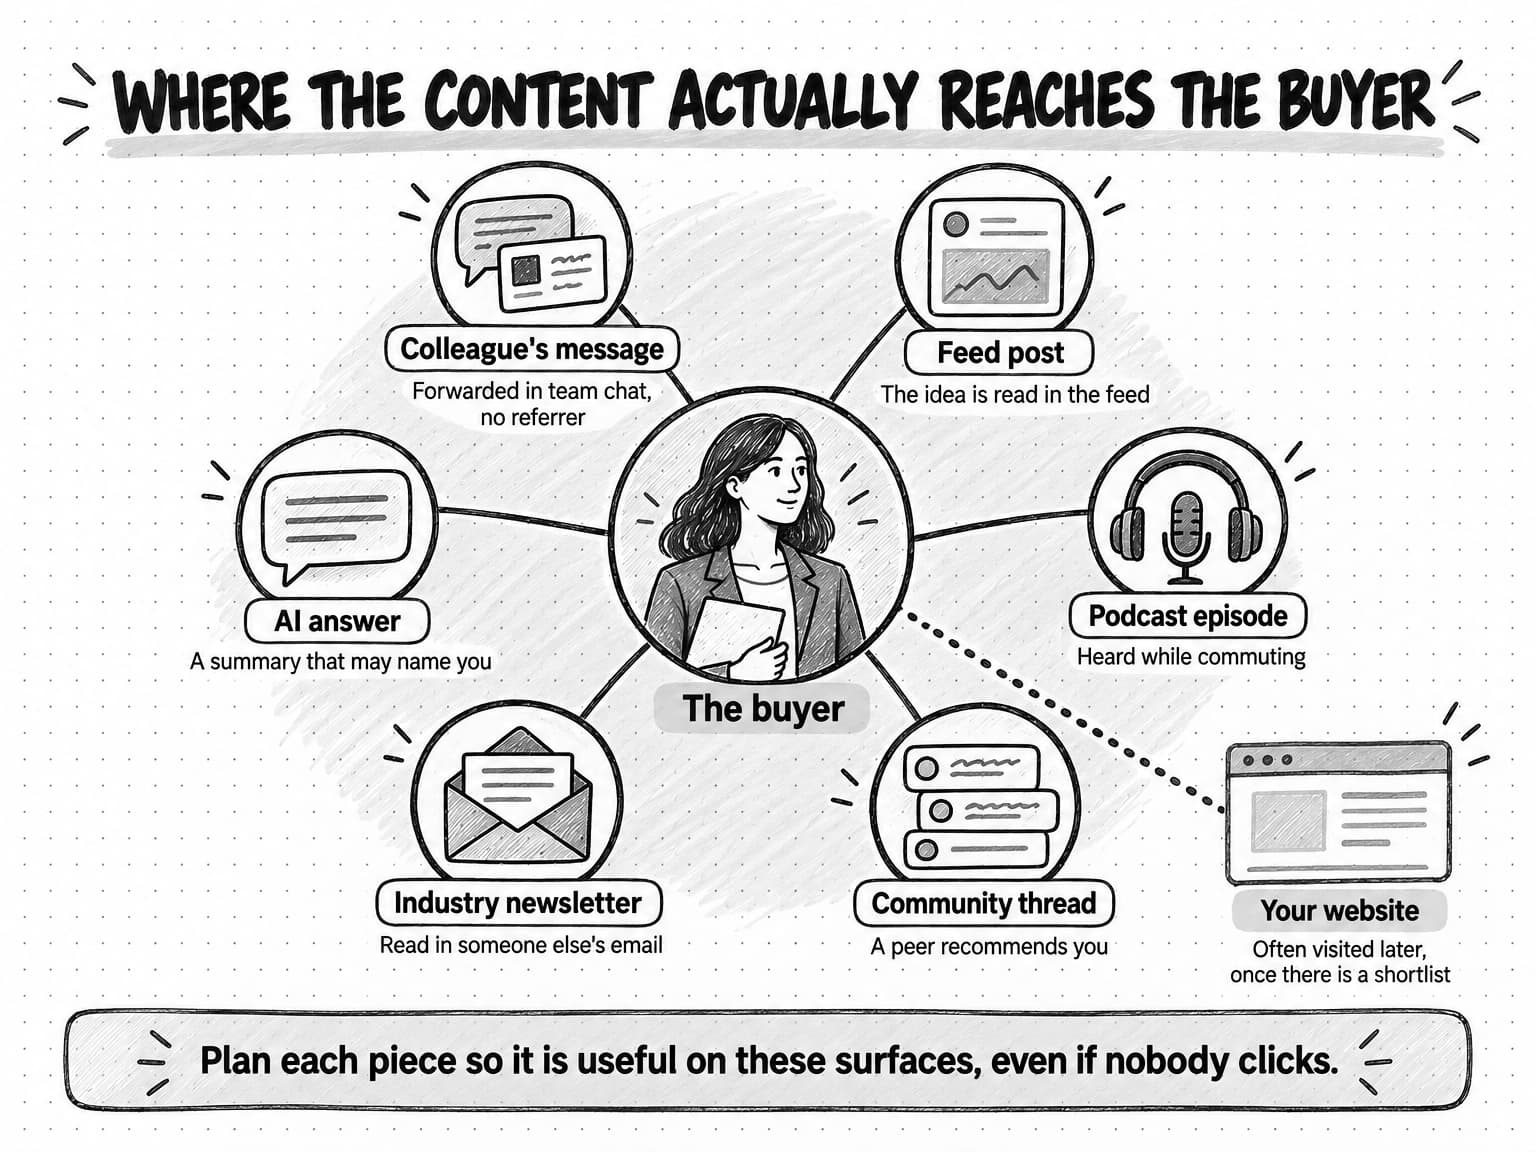
View the where content reaches the buyer diagram at full size (opens in a new tab).
This changes the job of distribution. The older model treated every channel as a way to send traffic back to an article, where the reader would convert. That model still works for some readers and some searches. But for a growing share of B2B attention, the post, the episode, or the answer is the only part of your content the buyer will ever see. If the value lives only behind the link, most of the audience gets nothing, and the company gets no credit.
This guide covers what the click data says and how far to trust it, a map of the five kinds of channels a lean team can use, how to package each piece so it works natively, a four-week plan, and how to measure attention that doesn't produce a click.
How much search stopped sending clicks, by study
The phrase "zero-click" is often attached to one dramatic number, but the evidence comes from several studies that measure different things, so read each by its method before using its figure.
The most direct measure of user behavior comes from Pew Research Center. Pew tracked the browsing of 900 U.S. adults who agreed to install tracking software in March 2025 and analyzed 68,879 unique Google searches. About 18% of those searches produced an AI summary (Google calls these AI Overviews); Pew collected the results pages for the searches in April 2025 to see which showed one. Pew reported in July 2025 that users clicked a traditional search result in 8% of visits to a results page with an AI summary, compared with 15% of visits to a page without one. Users clicked a link inside the summary itself in about 1% of visits. They were also more likely to end their browsing session entirely after a page with a summary: 26% of the time, against 16% for pages without one.
% of results-page visits
View the data
| Period | % of results-page visits |
|---|---|
| Result click, no AI summary | 15 |
| Result click, with AI summary | 8 |
| Click inside the AI summary | 1 |
Pew Research Center, browsing data from 900 U.S. adults and 68,879 unique searches, published July 22, 2025. All three figures come from the same panel and method.
Other studies use different data and answer different questions:
| Study | What it measured | Method and sample | Finding |
|---|---|---|---|
| SparkToro, July 2024 | Share of all Google searches that ended without a click | Clickstream panel from Datos, U.S. and EU, desktop and Android mobile (no iPhones), 2024 | 58.5% of U.S. searches and 59.7% of EU searches ended without a click; about 360 of every 1,000 U.S. searches sent a click to a site outside Google |
| SparkToro, June 2026 | The same question, with a different panel | Similarweb desktop and mobile web panel, U.S., January to April 2026, Google app excluded | 68.01% of searches ended without a click; the author warns the panel differs from 2024, so the two years should not be compared |
| Ahrefs, February 2026 | Click-through rate for the top organic result when an AI Overview appears | 300,000 keywords, aggregated desktop Search Console data, December 2023 against December 2025 | Position 1 click-through rate was 58% lower than forecast on keywords with an AI Overview; a correlation, not proof of cause |
| Seer Interactive, November 2025 | Organic and paid click-through rate on informational queries | 3,119 queries across 42 client organizations, 25.1 million organic impressions, June 2024 to September 2025 | Organic click-through rate on queries with AI Overviews fell from 1.76% to 0.61%; queries without AI Overviews also fell, from 2.72% to 1.62% |
These rows can't be compared with each other. SparkToro counts every search, including people typing a company name. Ahrefs and Seer measure click-through rates on chosen keyword sets from site owners' data. Pew measures individual people. The direction is consistent, though: when an AI summary sits above the results, fewer people click through, and even pages without summaries are getting fewer clicks over time.
Google disputes the third-party picture. In an August 2025 post, Liz Reid, the head of Google Search, wrote that total organic clicks to websites had been "relatively stable year-over-year" and that Google was sending slightly more "quality clicks", where the user doesn't quickly return to the results. Google didn't publish the underlying data, and an aggregate across all websites can hide large shifts between kinds of sites.
For a B2B team, the practical reading is modest. Informational searches, the kind that used to bring readers to a "what is" article, are the most likely to be answered on the results page. Plan as if your educational content will often be read as a summary on someone else's surface, and make sure the summary carries your name and your idea.
Where B2B buyers find content now
Search is only one place buyers learn, and for many B2B purchases it is not the main one. A Gartner survey of 645 B2B buyers, conducted in August and September 2025 and published in May 2026, found that buyers used an average of seven information sources during a purchase. Forty-five percent had used generative AI tools during the purchase. Sixty-seven percent said they preferred a buying experience without a sales rep, and yet 69% said they preferred to check AI-generated insights with a sales rep.
That is a buyer who gathers information from many places, mostly without the vendor present, and then checks it. The sources fall into a few groups:
- Peers and colleagues, through direct messages, internal chat, email forwards, and events.
- Social platforms, especially LinkedIn, where posts by founders and practitioners reach people who never follow the company page.
- Other people's audiences, such as podcasts, industry newsletters, analyst notes, and partner content.
- Communities, such as Slack and Discord groups, forums, and professional associations, where buyers ask each other for recommendations.
- AI answers, which may or may not name your company or link to your page.
- Your own site and email, which buyers often visit later, once they have a shortlist.
Our guide to the B2B buyer journey explains how these touchpoints fit into a buying decision. For distribution, the point is that most of them sit outside your website, and several can't pass a referral to your analytics even when they send a visit.
The content distribution map: owned, rented, borrowed, earned and AI answers
A distribution map is a list of every channel your content can reach buyers through, grouped by how much control you have and what the buyer gets there without clicking. A useful version has five groups. The first four follow the familiar owned, paid, earned split, adjusted for how B2B content travels now; the fifth, AI answers, behaves differently enough to deserve its own row.
| Channel group | Examples | What you control | What the buyer gets without clicking | What you can measure |
|---|---|---|---|---|
| Owned | Website, blog, email newsletter, product, documentation | Almost everything: format, timing, access, the list itself | The email itself, if it carries the idea; the page, once they arrive | Visits, subscribers, replies, conversions, branded search |
| Rented | LinkedIn, X, YouTube, Instagram, TikTok, Facebook | The post; not the feed, the reach, or the rules | The full post, document, or video in the feed | Platform metrics (impressions, saves, comments, followers), profile visits |
| Borrowed | Podcasts, other people's newsletters, partner webinars, guest articles, syndication | Your contribution, within the host's format | The episode, the feature, or the republished article | Host-reported numbers, promo codes, self-reported attribution |
| Earned | Press coverage, analyst mentions, community recommendations, other people's posts and lists | Very little: the quality of what you give them | Whatever the writer or member chose to say about you | Mentions, referral visits when links exist, self-reported attribution |
| AI answers | Google AI Overviews and AI Mode, ChatGPT, Perplexity, Gemini, Copilot | Indirect: the public content and mentions the systems draw on | A synthesized answer that may name you, cite you, or omit you | Sampled mentions and citations, AI referral visits, self-reported attribution |
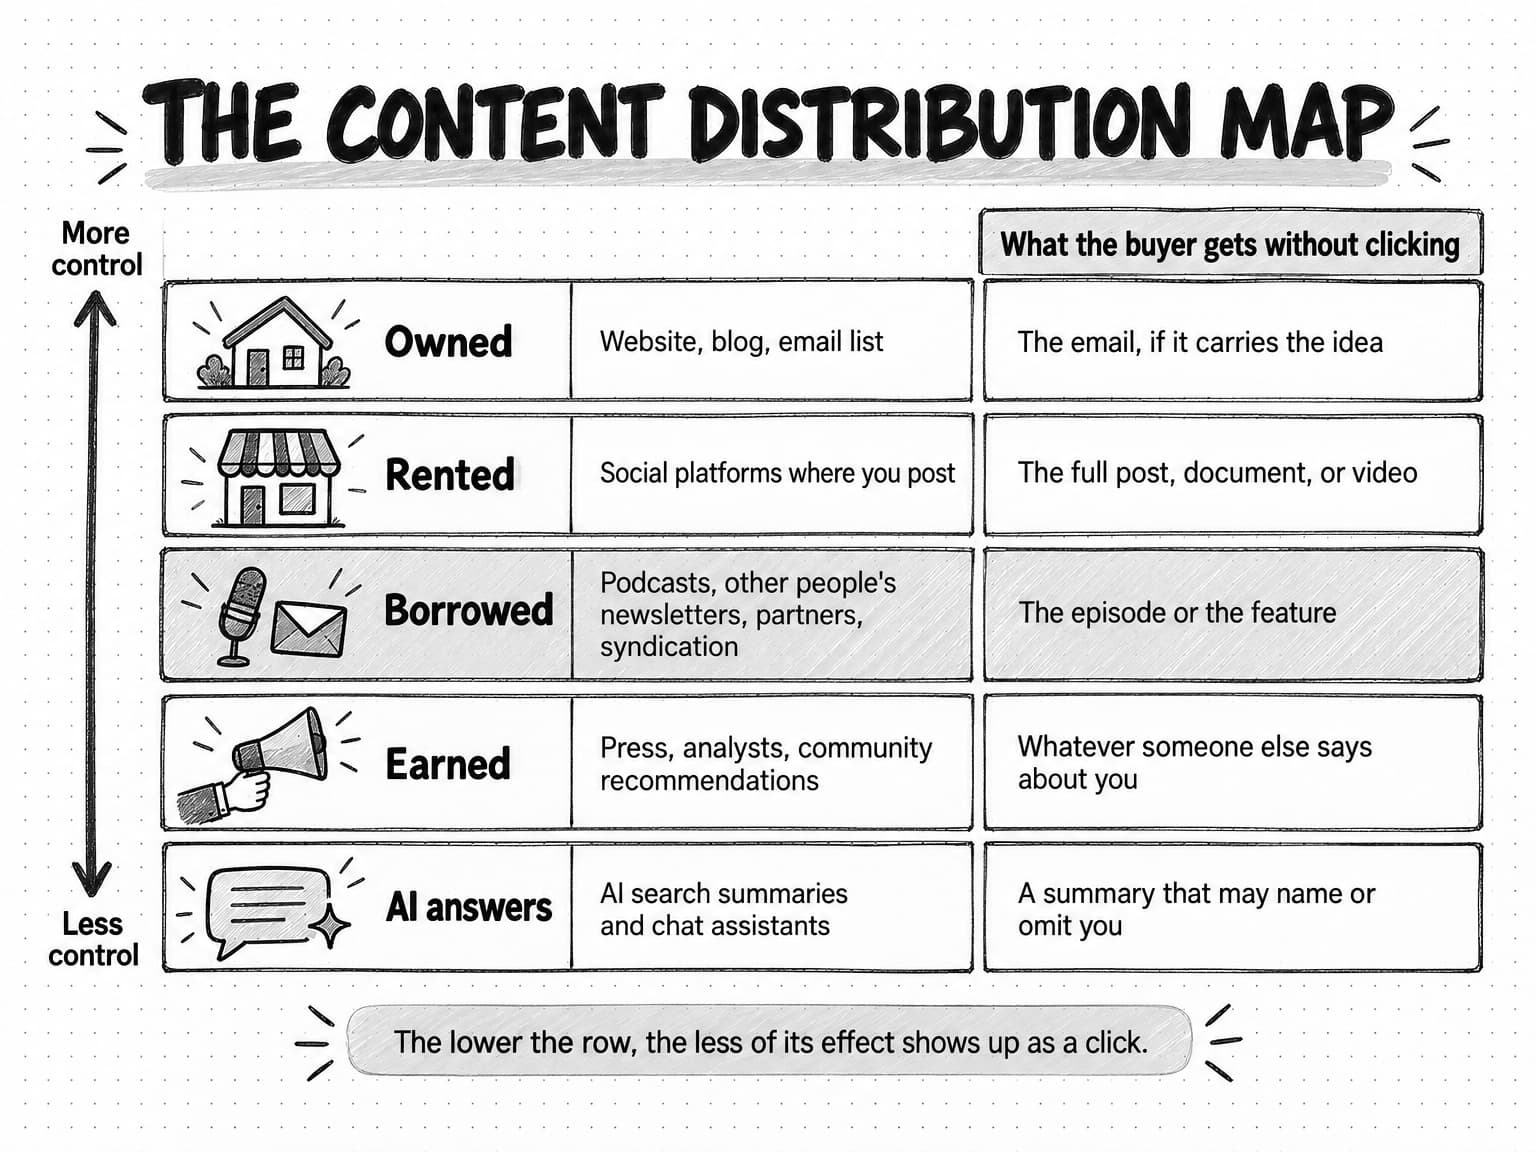
View the content distribution map at full size (opens in a new tab).
The map shows where the gaps are. Many small B2B teams put nearly all their effort into the blog and the company page on LinkedIn, with nothing borrowed or earned. It also sets expectations for measurement: the further down the table a channel sits, the less of its effect shows up as a click, and the more you depend on what buyers tell you.
Rented channels deserve the name. The platform can change what it shows, to whom, and its rules about links without notice, so use them well and keep moving the people you meet there toward something you own, such as an email list. Borrowed channels are the most underused group for small companies: a podcast host or newsletter writer has already built the trust you would otherwise spend a year earning. Earned attention is the hardest to plan, because someone else decides, but original data, a clear framework, or an evidenced opinion gives people something worth repeating; our guide to original research content covers how to produce findings others cite. AI answers combine features of the other four: they draw on your pages and on what others say about you, and you have no direct say in the summary.
Native content: put the value where the reader already is
Native content is content made for the platform where it appears, complete enough to be useful there without a click. A native LinkedIn post states the idea, the evidence, and the takeaway in the post itself. A native document post carries the framework on its pages. A native short video makes its point in the first seconds, with captions for people watching with the sound off. A native newsletter feature gives the reader the finding, not just a teaser for it.
The alternative is the familiar link post: a line or two of introduction, a link to the article, and perhaps "read more on our blog". For the reader, a link post asks for a decision before it has given them a reason. For the company, it hides the value behind a step most people won't take.
A practical test for any distribution asset is the no-click test: if a buyer read only this post, episode clip, or newsletter feature and never clicked, what would they know, and would they remember who told them? An asset passes when it gives one complete, useful idea, names the company or person behind it in a natural way, and gives the curious reader somewhere to go next.
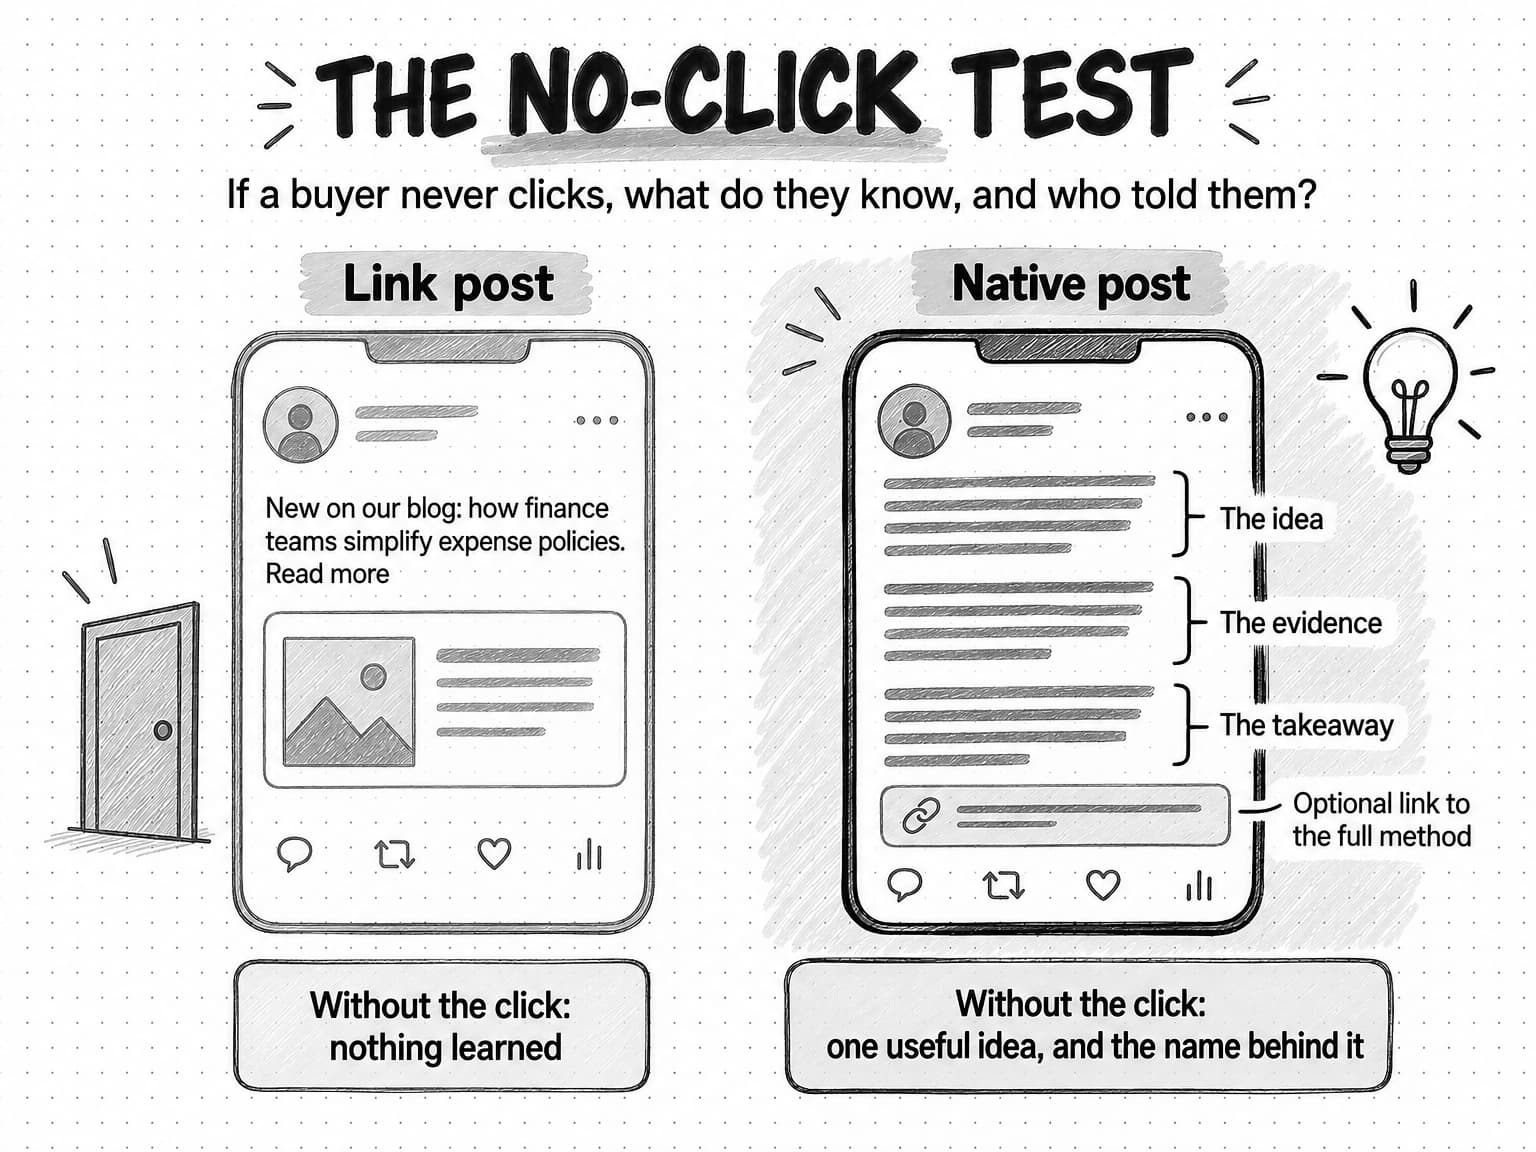
View the no-click test diagram at full size (opens in a new tab).
Native-first keeps links but changes their role. The link becomes an option for readers who want the full method or data, placed after the value. Where to put it differs by platform, as the next section shows; the post has to work for the reader who never clicks either way.
One long article can become several native assets, each complete in itself: a text post that argues the main point, a document post that walks through the framework, a short video of the author on the finding that surprised them, and a newsletter section that applies the idea. Our guide to repurposing content across channels covers how to adapt a source for each format without losing what the evidence supports. The distribution decision that comes first is which channels on your map deserve a native version, and in what order.
A checklist for a native asset:
- The idea is complete. A reader can state the main point and one supporting fact after reading.
- The format fits the job. Text for an argument, a document or carousel for a sequence, video for something that must be shown, a poll for a real question.
- The source is visible. The company, product, or author is named once, where it's relevant, not stamped on every line.
- The claim is checked. Any figure carries its source and date, and nothing in the native version goes further than the original evidence.
- The next step is optional and specific. "The full benchmark, with the method, is in the report" is better than "Link in comments."
What platforms say about link posts
Advice on link posts is full of folklore, such as "the algorithm buries links" or "always put links in the first comment", usually given without a source. It helps to separate what each platform has said from what independent studies have measured.
LinkedIn. LinkedIn's own published explanations of its feed describe matching posts to members by professional subject and relationship, reading signals such as time spent on a post as well as reactions, and reducing engagement bait and recycled posts. In the statements reviewed for our LinkedIn content strategy guide, LinkedIn doesn't say it penalizes posts that contain links. Independent data does show a consistent pattern. Socialinsider, a social media analytics company, analyzed 1.3 million posts from 16,645 LinkedIn business pages published between January 2024 and December 2025, and reported in March 2026 that link posts had the lowest average engagement rate of any format, about 3.25% in 2025, while native documents had the highest. Buffer's 2025 analysis of more than 2 million LinkedIn posts also found that link posts had the lowest median engagement rate. These studies show association, not a mechanism: link posts may do worse because readers leave, because they carry less content, or both.
X. X has said more, in less formal ways. On October 3, 2023, Elon Musk, X's owner, said in a post that "our algorithm tries to optimize time spent on X, so links don't get as much attention", and he encouraged people to post long-form content on the platform instead; around the same time X removed headlines from link previews, as TechCrunch reported on October 5, 2023. In November 2024, replying to a complaint from the investor Paul Graham that X deprioritized posts with links, Musk advised writing a description in the main post and putting the link in a reply, as The Washington Post reported, in a story summarized by the Benton Institute. In July 2026, according to a PPC Land report, Musk replied in a thread that X hadn't penalized link posts "for over a year", and Nikita Bier, a product lead at X, said users no longer needed to put links in replies. These are informal posts rather than documentation, and X hasn't published data showing how link reach changed. Treat the current position as stated but unverified, and test it on your own account.
Facebook. In December 2025, Meta confirmed to TechCrunch that it was running what a spokesperson called a limited test, restricting how many posts with links some professional-mode profiles and Facebook Pages could publish without a paid Meta Verified subscription. A screenshot shared by the social media strategist Matt Navarra showed test users limited to two link posts unless they paid; Meta didn't confirm the number. Links in comments were not affected, and publishers were not part of the test. It shows that a platform can change how links work for a business account with little notice.
Communities. Forums, subreddits, and professional groups usually set their own rules on self-promotion, often stricter than the platform's. Many limit or ban posting links to your own content, and moderators remove posts that look like marketing. The rules are usually in a sidebar, a pinned post, or a wiki page, and reading them is the first step before posting anything.
The evidence is consistent enough to plan around. X's owner has said its ranking favors time spent on the platform, and the LinkedIn benchmarks show link posts drawing the least engagement. The safe default is a native post that delivers the value, with a link offered as an extra, then a test of link placement on your own account rather than a rule copied from someone else's.
Dark social: the sharing your analytics can't see
Dark social is sharing that happens in private channels, such as direct messages, internal chat tools, text messages, and email, where analytics tools can't see where a visit came from. Alexis Madrigal coined the term in The Atlantic in October 2012, after noticing that a large share of the magazine's traffic arrived with no referring source. He argued that most of it was not people typing the address but people sending links to each other through channels that left no trace.
Dark social matters in B2B because buying is a group activity. One person finds an article or a podcast episode and drops it in the team's chat with "worth reading before Thursday's call." Three colleagues read it. None of them saw the original post, and none of their visits can be traced to it.
The mechanics explain why. When someone clicks a link, the browser can send a referrer, the address of the page they came from. Under the default policy described in MDN's Referrer-Policy reference, a cross-site click usually sends only the domain, without the path. A click from an app or an email client can arrive with no referrer at all. Google Analytics 4 groups a visit with no source as Direct, which its default channel definitions describe as traffic arriving via a saved link or by entering your URL. Some Direct traffic really is people typing your address; some of the rest is likely dark social.
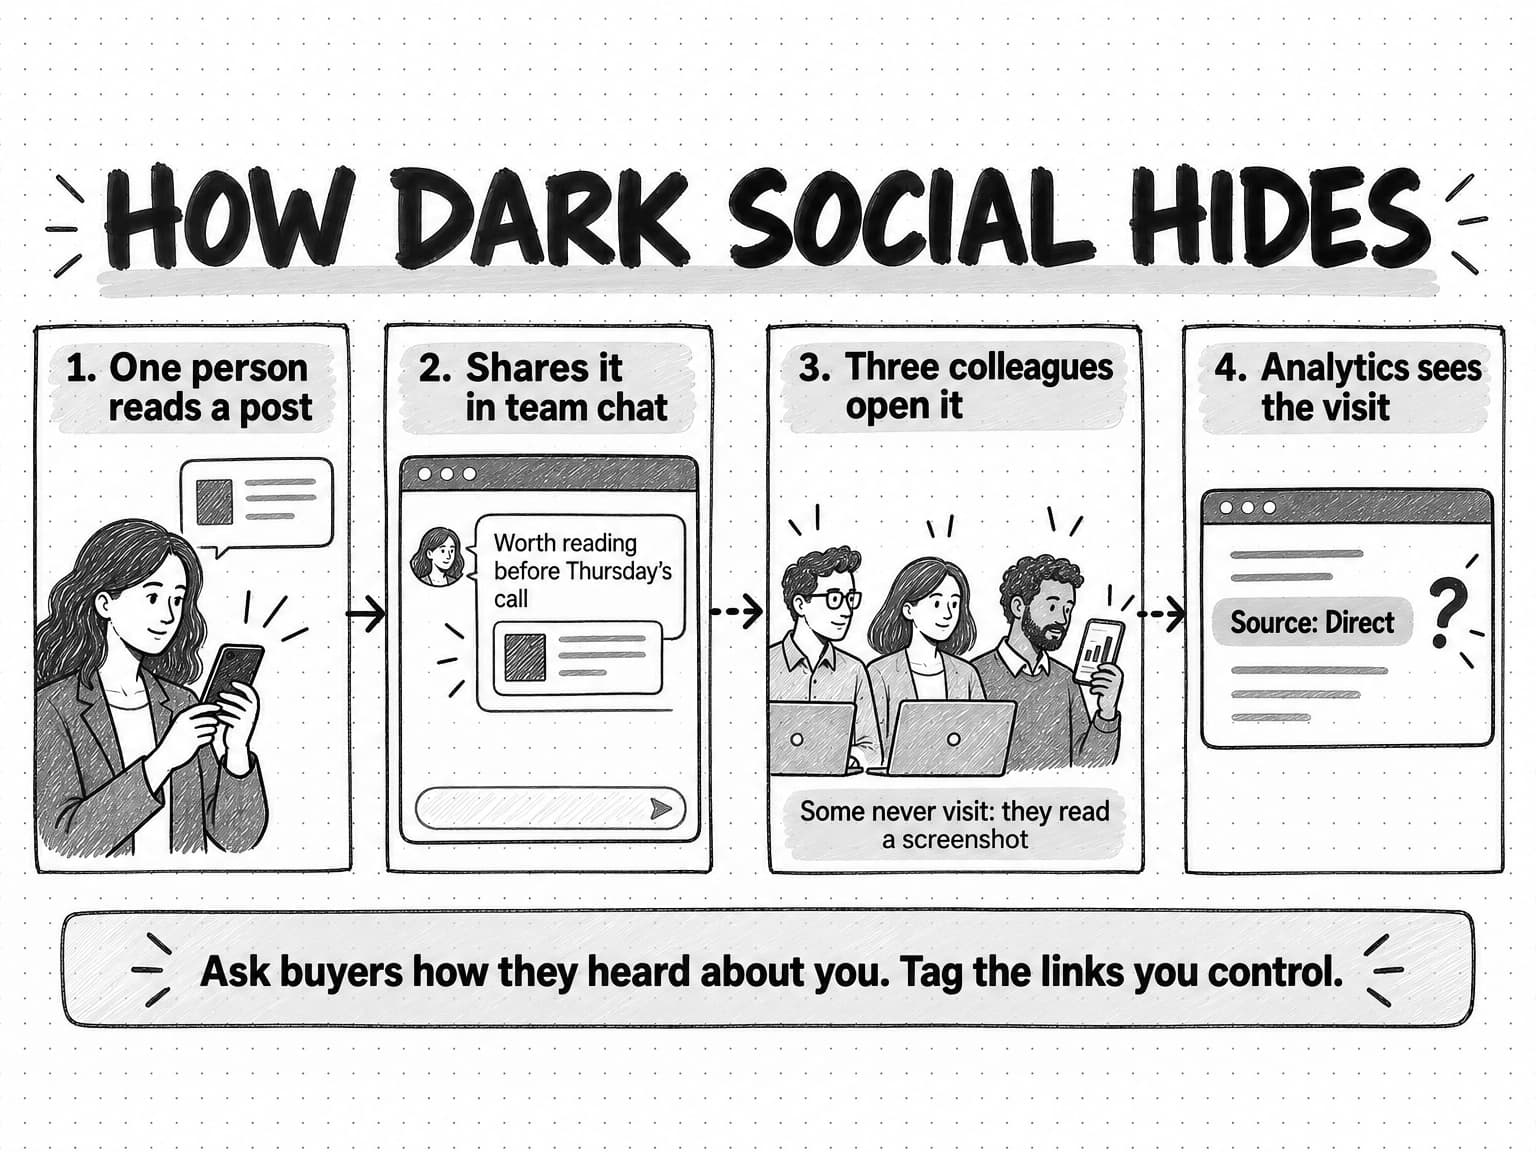
View how dark social hides at full size (opens in a new tab).
Then there is sharing that never produces a visit: a screenshot of a chart, a podcast quote repeated in a meeting, a founder's post pasted into a sales channel. No tool will count it.
What to do about dark social:
- Make content easy to share in private. A chart that makes sense as a screenshot, with the source written on it. A one-paragraph summary at the top of a report that someone can paste into a chat. A document post a colleague can download.
- Tag the links you control. Add campaign parameters (UTM tags) to links in your own newsletters, partner placements, and podcast show notes, so that visits from those sources don't fall into Direct.
- Watch Direct and branded search as trends, not as totals. A rise in Direct traffic to deep pages, which people rarely type by hand, often follows a piece of content being shared privately.
- Ask. The most reliable way to learn about dark social is to ask buyers how they heard about you, which the measurement section covers.
Trying to eliminate dark social costs more than it reveals. Link shorteners, tracking pixels, and forced sign-ups each show a little more and cost a lot of goodwill. The sharing happens because the content was useful enough to pass on, which is the result you want.
Borrowed audiences: podcasts, newsletters, partners and syndication
Borrowed channels reach an audience someone else has built. The principle is the same for each: give the host's audience something useful in the host's format, and the host becomes a credible messenger for you.
Podcasts. A guest appearance gives a founder or subject expert half an hour or more with listeners who chose to spend that time, often a small and specific audience, which suits B2B. Pitch one clear idea the host's audience cares about rather than your company's story, and bring two or three examples or numbers you can stand behind. Afterward, cut a short clip of the strongest answer and write a post summarizing the argument. Ask for the show-notes link to point at a tagged page made for their listeners, so the visits that do happen are counted.
Other people's newsletters. Industry newsletters reach readers who opened an email on purpose. The ways in are a contributed piece or data point, a sponsorship, or a mention earned because you made something worth covering. Offer the writer something their readers can't get elsewhere, such as a finding from your own data, and accept that the writer will shape it. A sponsored placement should still pass the no-click test, with a line that teaches something.
Partners. Companies that sell to the same buyers without competing with you, such as integration partners and agencies, can co-host a webinar, co-write a guide, or swap newsletter features. It works when the content is useful to both audiences and each side does real work.
Syndication. Content syndication means republishing the whole of an article, or a substantially similar version, on another site with the original publisher's permission. It raises a search question: which version should Google show? Google's Publisher Center guidance on article duplication recommends that syndication partners block indexing of the syndicated copy with a robots meta tag, and says the canonical link element is not recommended for syndicated content, because syndicated versions often differ from the original. Google also describes a canonical tag as a hint rather than a rule, so it may choose a different page as canonical than the one you name. If you syndicate, agree with the partner in writing that their copy carries a noindex tag and a clear credit and link to the original, and publish your version first.
The term "content syndication" also has a second meaning in B2B marketing: paid lead-generation programs in which a vendor places your gated content on publisher networks and sells you the contact details of people who download it. That is a paid acquisition channel with its own lead-quality questions, separate from editorial syndication.
Borrowed channels also matter for AI answers. A podcast transcript, a newsletter archive, or a partner's guide that discusses your research is one more credible place where your name appears next to the topic.
Communities and earned media
In communities and earned media, someone else decides whether you appear, which makes both slower to build and more credible when they work.
Communities are groups where buyers talk to each other: Slack and Discord groups for a profession, subreddits, forums, user groups for a software category, and local meetups. Buyers go there to ask peers for recommendations. A useful way to work in them:
- Choose two or three, not twenty. Pick communities where your buyers actually ask questions, which you can find by asking customers where they go for advice.
- Read before posting. Learn the rules, the tone, and what gets removed. Many communities ban self-promotion outright or confine it to a weekly thread.
- Answer questions as a person. The founder, a product expert, or a support lead answering a real question in full, with no link unless it's asked for, builds the kind of reputation that leads to recommendations.
- Share when it's useful. When a thread asks something your content answers, give the answer in the thread, and mention the longer piece only if it helps.
- Disclose. Say who you work for when you mention your own company or product.
Community work is slow, and most of it will never be attributed. It is also where the "a friend in a Slack group recommended you" answer on a sign-up form comes from.
Earned media is coverage you don't pay for: press articles, analyst mentions, other people's lists and roundups, conference talks, and posts by people outside the company. For a small team, the reliable route is to make something worth covering, then make it easy to use: original data or a clear framework to cite, a short summary, a chart with its source, and a named person available for comment.
An author with a distinct, evidenced point of view is more likely to be quoted, invited on podcasts, and recommended, as our guide to what thought leadership is explains. Research reports and white papers can earn attention when the finding is new, though, as our guide to what a white paper is shows, their reach depends as much on the promotion plan as on the document.
AI answers as a distribution channel
A buyer asks ChatGPT, Perplexity, Gemini, Copilot, or Google's AI Mode which tools solve a problem or what a term means, and gets a synthesized answer that may name your company, cite your page, or leave you out. Gartner's finding that 45% of buyers used generative AI during a purchase shows how common this has become in B2B. AI answers differ from other channels in three ways.
The click is rare. In Pew's study, users clicked a link inside Google's AI summary in about 1% of visits. Whether you are named and described accurately matters more than whether you are linked.
The sources are other people's surfaces as well as yours. In the same Pew study, the sources most often cited in AI summaries were Wikipedia, YouTube, and Reddit, which together accounted for 15% of the summaries' sources. Your own pages matter, and so do the podcast transcripts, community threads, partner articles, and press coverage that discuss you. Our guide to how AI search engines choose which sources to cite explains why third-party pages are often picked over a company's own. Seer Interactive's client data found that, in the third quarter of 2025, brands cited in an AI Overview had organic click-through rates about 35% higher and paid click-through rates about 91% higher than brands that weren't cited; that is a correlation within one agency's client set, and Seer itself says it can't prove that citation causes the higher rates.
Answers vary. The same question asked twice can produce different answers with different sources, as our guide to why AI gives different answers explains. A single check proves little.
No one can promise that a company will be cited in AI answers. You can make it easier for the systems to find and describe you correctly, which is the work now often called generative engine optimization. Google's documentation on AI features and your website says there are no additional requirements beyond normal Search: a page must be indexed and eligible to appear with a snippet to be shown as a supporting link. Our SEO audit checklist shows how to check both. Beyond that, the work is what this guide already describes: clear pages that answer buyers' questions, original information others cite, accurate descriptions of you on borrowed and earned surfaces, and consistent product facts everywhere.
To check whether it's working, sample a fixed set of buyer questions on the AI surfaces your buyers use, record whether you are mentioned, recommended, or cited, and repeat on a schedule. Our guide to measuring AI search visibility gives the full method, including how to recognize referral visits from AI assistants and run a baseline audit without overstating what a sample shows.
A distribution plan a lean team can run
Distribution plans fail in small teams because they assume time the team doesn't have. A plan that needs daily posting on five platforms won't survive the first busy month. A workable plan starts from the hours available. A sensible default for a team of one or two is to spend about as much time distributing a substantial piece as making it, which means publishing fewer pieces: one strong piece a month, distributed for four weeks, rather than four posted once each.
The plan below assumes one marketer with help from the founder, four to six hours a week for distribution, and one substantial piece a month, such as a guide, a research finding, or a webinar.
Week 1: launch on owned and rented channels.
- Publish the piece on the site, with a summary at the top a reader could paste into a chat.
- Send it to the email list as a native feature: the finding and the takeaway in the email, the full piece linked.
- Post a native text post from the founder or author that argues the main point.
- Post a document or carousel version from the company page with the framework or the data.
Week 2: borrowed channels.
- Send two or three personal pitches to podcast hosts or newsletter writers whose audience fits, offering the one idea or finding their readers would want.
- Offer a partner a co-branded version, a joint webinar, or a newsletter swap.
- If syndication fits, agree on noindex and credit before the partner republishes.
Week 3: communities and second-angle posts.
- Answer two or three real questions in the communities on your map, using the substance of the piece, with a link only where it's welcome.
- Post a second native asset from a different angle: a short video of the author, a poll that tests the main claim, or a post responding to the comments on the first one.
- Ask the sales or customer team to use the piece in conversations, and give them a two-line summary they can paste.
Week 4: earned and AI answers, then review.
- Send the finding, chart, and a named contact to two or three journalists, analysts, or list writers who cover the topic.
- Check the AI answers to the buyer questions this piece addresses, so later checks have a baseline.
- Review the distribution log: what was published where, what responses came in, what buyers mentioned. Decide what to repeat next month.
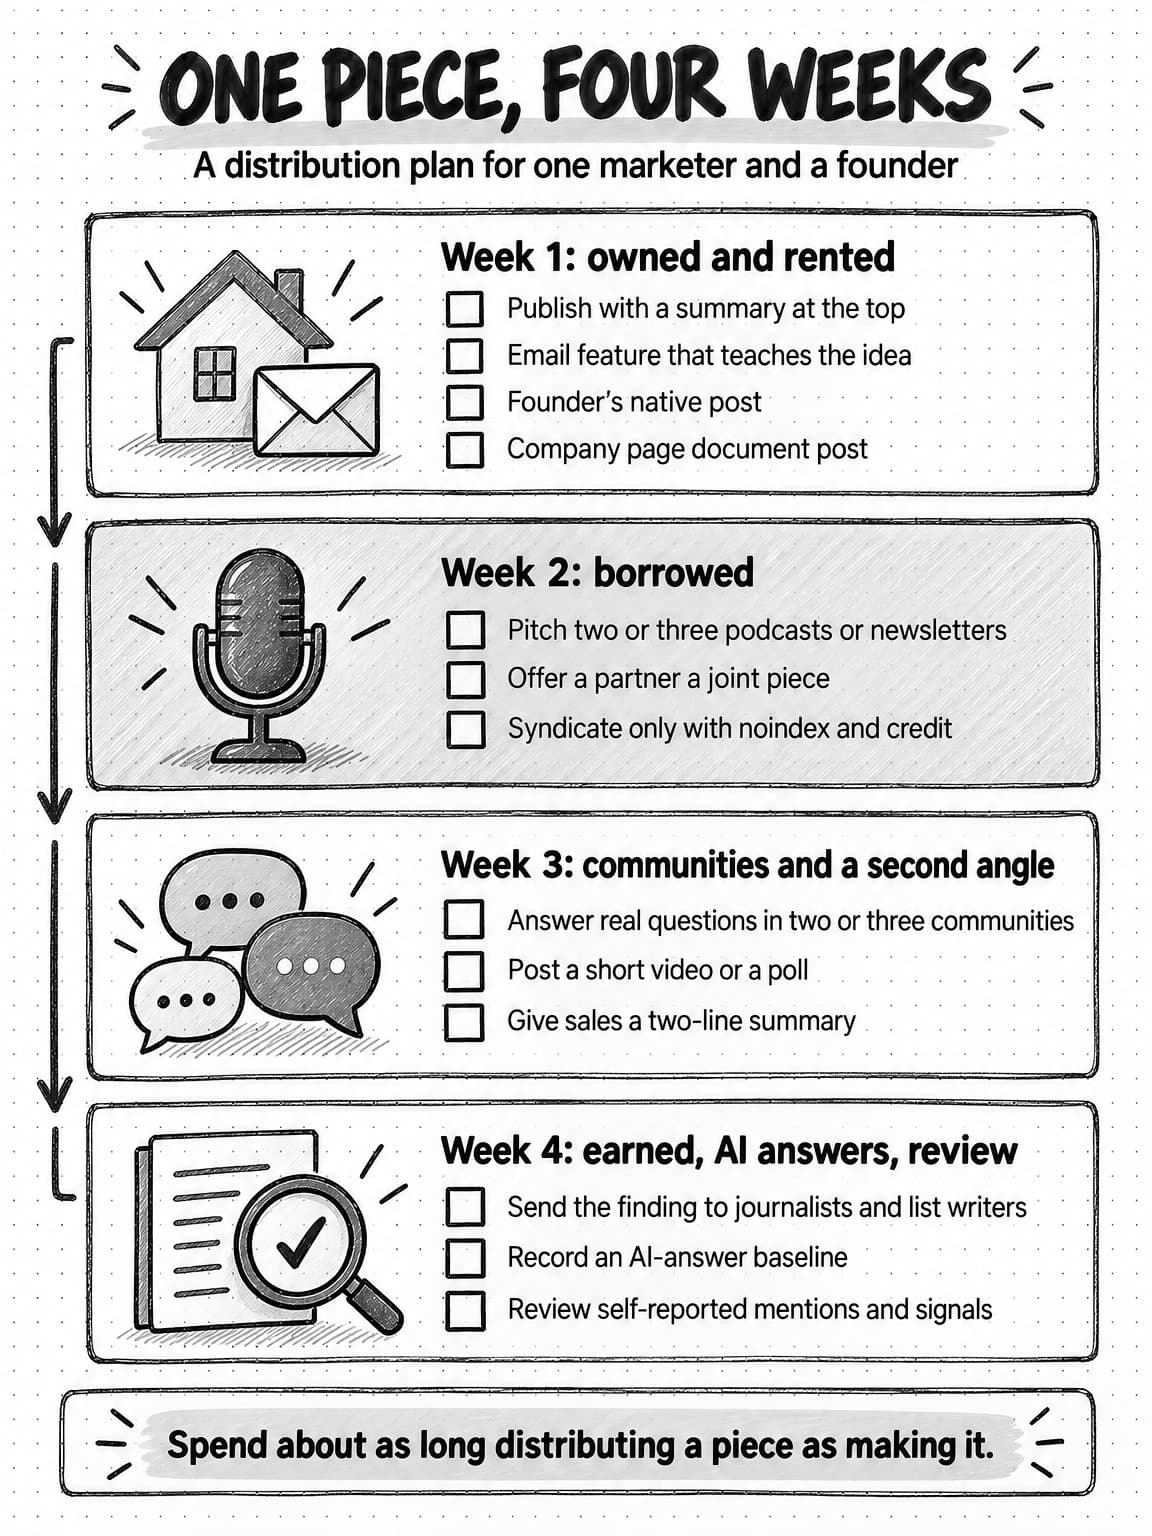
View the four-week distribution plan at full size (opens in a new tab).
A copyable distribution plan template for one piece:
Piece: [title, format, link]
Main idea in one sentence: [what a reader should remember]
Who it is for: [buying role and situation]
Proof: [the data, example, or source that supports the idea]

Owned
- Site page: [date] | summary at top: [yes/no]
- Email feature: [date] | native version: [what the email itself teaches]

Rented
- Founder or author post: [platform, date, format, angle]
- Company page post: [platform, date, format, angle]
- Second-angle post: [platform, date, format, angle]

Borrowed
- Podcast or newsletter pitches: [host, audience, idea offered, status]
- Partner: [partner, format, status]
- Syndication: [site, noindex agreed: yes/no, credit link: yes/no]

Earned and communities
- Communities: [community, thread, what was shared]
- Press or analyst outreach: [contact, angle, status]

AI answers
- Buyer questions to check: [3 to 5 questions]
- Baseline result: [mentioned, recommended, cited, or absent, by surface]

Signals to review in week 4
- Self-reported mentions: [count and quotes]
- Native engagement from target buyers: [notable comments, saves, shares]
- Branded search and Direct trend: [direction]
- Sales conversations that mentioned the piece: [count]
- Next action: [repeat, adjust, or drop]
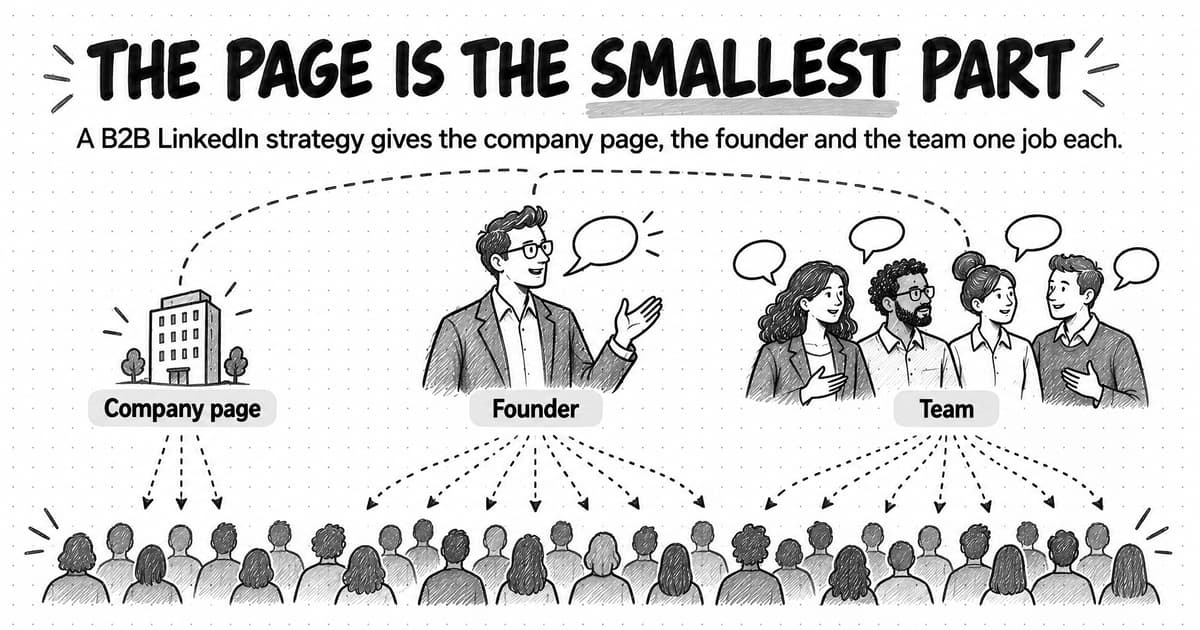
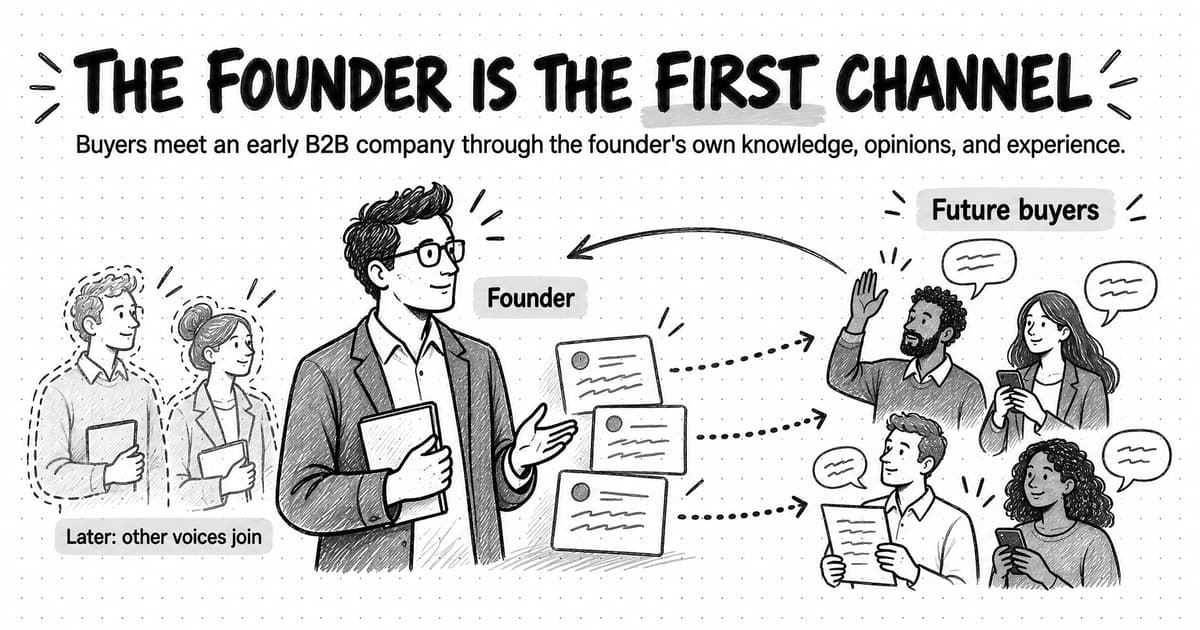
As the team grows, add a second person's voice before a second platform; our guide to founder-led marketing covers when the founder's channel is the right one and how to share it. Keep a cadence the team can hold for a quarter. For how distribution fits the wider plan, including the distribution brief that belongs with each piece, see how to build a content marketing strategy for B2B SaaS and AI companies.
How to measure content that doesn't get clicked
If much of your content's effect happens without a click, click-based measurement will undercount it, sometimes badly. Two tools fill most of the gap: ask buyers directly, then watch a small set of signals that move when distribution is working.
Self-reported attribution
Self-reported attribution means asking buyers how they found you, in their own words, at a moment when they're paying attention, and treating the answers as evidence. The usual form is a required "How did you hear about us?" field on a demo request or sign-up form, plus the same question asked in the first sales conversation.
Software attribution records the last trackable click; self-reported attribution records what the buyer remembers. Both are partial. A buyer who saw five founder posts, heard a podcast episode, and then searched your company's name will appear in analytics as "organic search, branded". They might write "Heard your CEO on a podcast."
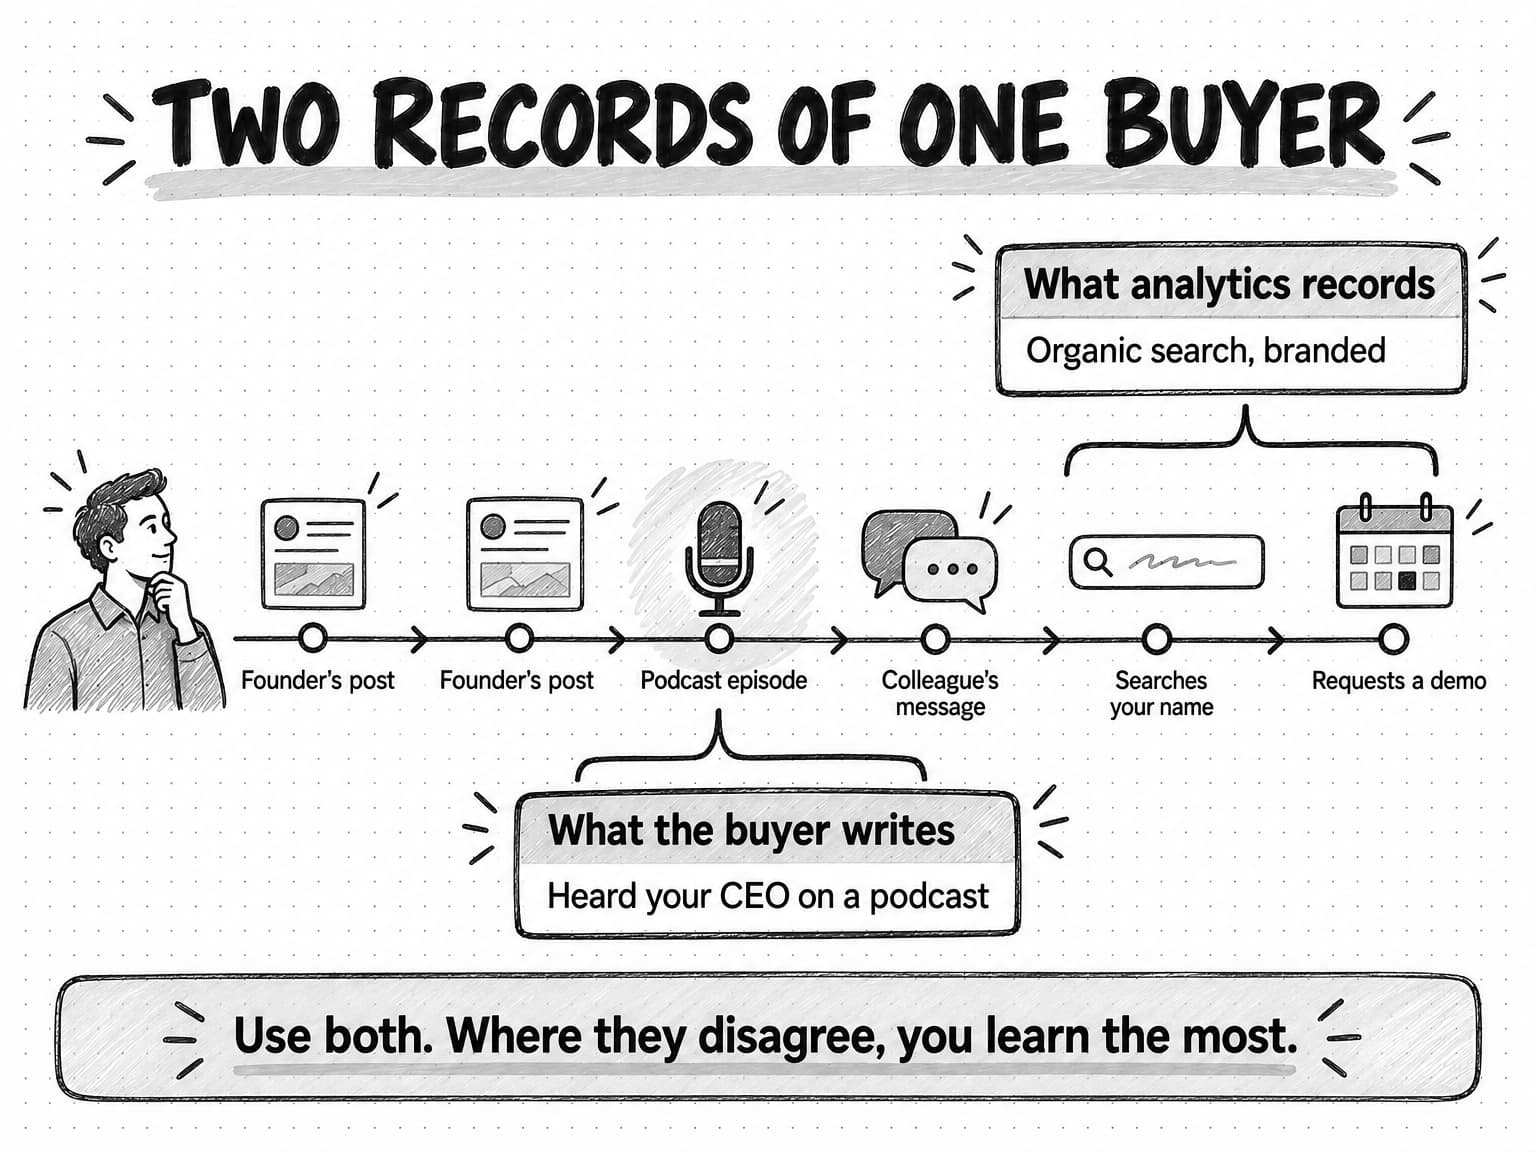
View the two records of one buyer diagram at full size (opens in a new tab).
How to set it up well:
- Use an open text field. A dropdown limits the answer to the options you thought of, and buyers often pick the first plausible one. An open field captures "my colleague sent me your post about pricing pages", which a dropdown never would.
- Make it required, but short. One field, with a placeholder such as "A podcast, a colleague, a LinkedIn post...", so people know what kind of answer you mean.
- Ask again in conversation. A sales rep or founder asking "What made you reach out now?" often gets a fuller story than a form does. Write the answer in the CRM in the buyer's words.
- Code the answers monthly. Read every answer and tag it with the channel group from your map (owned, rented, borrowed, earned, AI answers) and, where named, the specific source. Keep the original words next to the code.
- Count patterns, not single answers. One mention of a podcast is an anecdote. Five in a quarter is a channel.
The method has known limits. People forget, compress several touchpoints into one, name the most memorable source, or write "Google" when they searched your name after hearing about you elsewhere. The answers are recollections, so use them alongside software attribution; where the two disagree, the disagreement is often the most useful finding.
Five signals to watch alongside it
Pick a small set of signals that change when distribution is working, and review them monthly. Five is usually enough:
| Self-reported mentions by channel | Count of coded 'How did you hear about us?' answers per channel group each month, with quotes. The most direct evidence of zero-click influence. |
|---|---|
| Branded search | Searches that include your company or product name. Search Console's branded queries filter, announced in November 2025, separates them where available. A rise after a distribution push suggests people heard about you somewhere and looked you up. |
| Direct visits to deep pages | Direct traffic to specific articles or reports, which few people type by hand. A rise often follows private sharing. |
| Quality of native engagement | Comments, saves, reposts, and replies from people who match your buyer profile, read individually rather than counted in total. |
| Content mentioned in sales conversations | How often prospects or customers refer to a post, episode, report, or idea in calls and emails, logged by the sales team in the CRM. |
Add AI answer sampling as a sixth signal if buyers in your market use AI tools heavily, using the method in the AI search visibility guide.
Some numbers are less useful than they look. Impressions count how often a platform showed a post, not how many people read it. Follower counts say little about whether the right people are paying attention. Treat both as context.
A content metrics review in 30 minutes
Once a month, one person can run a review in about half an hour:
- Read the month's self-reported answers and code them.
- Note the branded search and deep-page Direct trend against the previous three months.
- Read the best and worst performing native posts by quality of engagement, not reach, and note why each worked or didn't.
- Collect the sales team's content mentions.
- Write three lines: what worked, what to stop, what to try next month.
For the broader model that connects content to pipeline, see the measurement section of our content strategy guide; for judging the content itself, our guide to AI content creation covers how to measure quality rather than volume.
Worked example: one research finding, distributed for a month
This example is fictional. Brindlepost is an invented company, and the people, numbers, and results are illustrative, not data from a real business.
Brindlepost is a 14-person company that sells expense-policy software to finance teams at mid-sized companies. Its marketing team is one person, Ines, with help from the founder, Theo. Blog traffic had fallen for three quarters, and the "How did you hear about us?" field on the demo form, which Ines had added six months earlier, kept returning answers like "Theo's posts", "a friend in a CFO Slack group", and "ChatGPT recommended you".
Ines decided to stop publishing four blog posts a month and instead produce one substantial piece a month, distributed for four weeks. The first piece was a short research report: Brindlepost analyzed anonymized, aggregated policy settings from customers who had agreed to it, and found that companies with a single, simple meal-expense rule had far fewer out-of-policy claims than companies with tiered rules. The report stated the sample, the period, and the limits of a customer-only sample.
Here is how the month went, using the plan above.
Week 1. Ines published the report on the site with a five-line summary at the top and sent it to the 2,100-person newsletter list, with the main chart and the finding in the email itself. Theo posted a native text post on LinkedIn arguing that most expense policies are too complicated to follow, using the one finding and the chart, with the report linked in the comments. The company page posted an eight-page document version of the method and findings.
Week 2. Ines pitched three finance podcasts and two newsletters for finance leaders, each with the finding and one surprising detail. One newsletter writer ran the chart with a credit and link; one podcast booked Theo for a recording in week 4. A partner that makes accounting software agreed to a joint webinar the following month.
Week 3. Theo answered two threads in a finance leaders' community, one asking how to simplify a travel policy, giving the substance of the finding without a link, and adding it only when a member asked for the source. Ines posted a short video of Theo explaining the chart and a poll asking finance leaders how many meal-expense rules their policy had. She gave the sales team a two-line summary and the chart to use in calls.
Week 4. Ines sent the finding and the chart to two journalists who cover finance operations and to the author of a widely read list of finance tools. She also checked five buyer questions in three AI assistants, such as "how to reduce out-of-policy expense claims", and recorded that Brindlepost was mentioned in none of them, which became the baseline.
The month's review used the five signals:
| Signal | Result (illustrative) | Reading |
|---|---|---|
| Self-reported mentions | 11 of 34 demo requests named the report, Theo's posts, the newsletter feature, or the community thread | The highest monthly share since the field was added; the newsletter feature was named three times |
| Branded search | Up about 20% on the previous three-month average | Consistent with people hearing about the company and searching for it |
| Direct visits to the report page | About 300, more than the blog's typical article received in a month from all sources | Likely private sharing; two prospects said a colleague had sent it |
| Native engagement | Theo's post drew 40 comments, about a third from people with finance titles; the poll drew 180 votes | The poll comments produced three new questions for future content |
| Sales mentions | The chart came up unprompted in 6 sales calls | Sales asked for a one-page version to send after calls |
Link clicks from the LinkedIn posts were modest, and the report page got fewer search visits than the old blog posts had at their peak. By click-based measures alone, the month looked average. By the signals above, it was the most effective month of content the company had run.
Ines's three-line review read: the newsletter feature and the community answers produced more named mentions than any post; the company page's document post reached few people outside existing followers; next month, pitch two more newsletters and turn the sales team's request into a one-page summary. She also set a reminder to repeat the AI-answer check in eight weeks, since a single month is too soon to expect any change there.
Common content distribution mistakes
Posting the link and calling it distribution. One link post on the company page on publication day reaches a small share of followers and asks them to click before they've learned anything.
Spreading across every platform. Five platforms posted to weakly will usually do less than one or two posted to well. Choose channels by where your buyers actually are, which self-reported attribution will start to show you.
Judging content only by clicks. If a post teaches the whole idea in the feed and no one clicks, it may still have done its job. Read the comments, ask buyers, and watch branded search before deciding a piece failed.
Treating borrowed audiences as ad space. A podcast appearance spent describing your product, or a newsletter placement with only a logo and a tagline, wastes the host's trust. Bring an idea the audience can use.
Dropping into communities to promote. Joining, posting a link, and leaving tends to get the post removed and the company remembered for the wrong reason. Participate as a person over time.
Chasing AI citations with tricks. Stuffing pages with questions, publishing many thin pages, or making claims you can't support will not reliably earn mentions in AI answers, and it can damage the trust that does. The durable route is clear, accurate content and credible mentions elsewhere.
Never asking buyers. Without a "How did you hear about us?" field and a habit of asking in sales calls, zero-click distribution is invisible, and the team will eventually cut the channels that are working because they don't produce clicks.
Content distribution with Ampere
Ampere, the AI marketing agent, helps a lean team produce the native versions distribution needs, so people can spend their time on relationships with hosts and partners, community participation, and judgment about what to publish.
From a finished article, report, webinar transcript, or product update, Ampere can create channel-specific social packages for LinkedIn, X/Twitter, Facebook, Instagram, TikTok, and YouTube, including text posts, polls, newsletters, carousels, image posts, short videos, captions, and hooks. For LinkedIn text posts, native polls, and newsletters, it produces structured packages with format-specific drafts, review notes, claim checks, follow-up ideas, and saved Markdown deliverables. The team reviews and edits the drafts and decides what to publish and where; Ampere doesn't publish or post them.
Ampere starts from Brand memory, the saved context about your company, products, competitors, voice, and audience. Brand memory can include evidence-backed reports such as a channel footprint report and a communities report, which help when building the distribution map. For the company page, Ampere can audit one LinkedIn company page from up to about 70 of its recent public posts, covering cadence, format mix, topics, and engagement, and deliver an executive HTML report of opportunities by priority. The audit covers that one page, and public engagement counts can be partial.
For the AI-answer channel, Ampere's research tools can identify AI-search visibility gaps and produce AI-visibility reports, which give a starting point for the sampling method described above. Like any AI output, these drafts and reports can be inaccurate or incomplete, so someone on the team checks claims and figures before anything goes out.
Recurring work, such as a weekly set of native posts from the month's main piece, can run as a scheduled task that returns drafts for review. Eligible accounts in supported regions that have never had a paid plan can start on the Free Plan with no card: Ampere sets up Brand memory, then completes up to four Free tasks: a LinkedIn content audit, a LinkedIn image post, a LinkedIn carousel, and a LinkedIn text post. Your own prompts and follow-up questions, 200+ AI tools & skills, Scheduled Tasks, and Monitoring come with paid plans.
Sources and further reading
- Athena Chapekis and Anna Lieb, Google users are less likely to click on links when an AI summary appears in the results, Pew Research Center, July 22, 2025. Browsing data from 900 U.S. adults, March 2025; 68,879 unique searches.
- Rand Fishkin, 2024 zero-click search study, SparkToro, July 2, 2024. Datos clickstream panel, U.S. and EU.
- Rand Fishkin, In 2026, less than one third of Google searches still send a click, SparkToro, June 9, 2026. Similarweb panel, U.S., January to April 2026; not comparable with the 2024 panel.
- Ryan Law and Xibeijia Guan, AI Overviews reduce clicks by 34.5%, Ahrefs, April 17, 2025, and the February 2026 update, Ahrefs, February 4, 2026. Aggregated desktop Search Console data; correlation.
- Tracy McDonald, AIO impact on Google CTR: September 2025 update, Seer Interactive, November 4, 2025. 3,119 informational queries across 42 client organizations.
- Liz Reid, AI in Search is driving more queries and higher quality clicks, Google, August 6, 2025.
- Gartner, Gartner survey finds 69% of B2B buyers turn to sales reps to validate AI-generated insights, press release, May 20, 2026. Survey of 645 B2B buyers, August to September 2025.
- Elena Cucu, LinkedIn organic benchmarks 2026, Socialinsider, March 16, 2026. 1.3 million posts from 16,645 business pages.
- Tamilore Oladipo, How often should you post on LinkedIn? Data from 2 million+ posts, Buffer, August 28, 2025.
- Ivan Mehta, X cuts headlines from link previews as Musk wants users posting directly on the platform, TechCrunch, October 5, 2023.
- Will Oremus, "Musk admits X throttles links as 'news influencers' take over", The Washington Post, November 27, 2024, as summarized by the Benton Institute for Broadband & Society.
- PPC Land, X drops year-old link penalty, Musk tells Zuckerberg on platform, July 30, 2026. Reports informal posts; X published no data.
- Ivan Mehta, Facebook is testing a link-posting limit for professional accounts and pages, TechCrunch, December 17, 2025.
- Alexis C. Madrigal, "Dark Social: We Have the Whole History of the Web Wrong", The Atlantic, technology section, October 12, 2012. The origin of the term; the original page could not be retrieved for this guide, so only its coinage, date, and core argument are used.
- MDN Web Docs, Referrer-Policy header, accessed October 14, 2026.
- Google Analytics Help, Default channel group, accessed October 14, 2026.
- Google Publisher Center Help, Avoid article duplication in Google News, accessed October 14, 2026.
- Google Search Central, AI features and your website, last updated December 10, 2025.
- Google Search Central, Introducing the branded queries filter in Search Console, November 2025.
Frequently Asked Questions
What does content distribution mean?
Content distribution is the work of getting content in front of the people it was made for, through the channels where they already spend attention. It covers your own site and email, social platforms, other people's audiences such as podcasts and newsletters, earned coverage and community mentions, and AI answers. Good distribution adapts each piece to each channel so it is useful there, rather than posting the same link everywhere.
How do you build a content distribution strategy?
Start with a map of the channels your buyers use, grouped as owned, rented, borrowed, earned, and AI answers, and choose the two or three where you can do the most good with the time you have. Then plan each substantial piece as a four-week sequence of native versions across those channels, record what you published in a distribution log, and review buyer-reported attribution and a few signals monthly.
What are the main types of content distribution channels?
Content distribution channels fall into five groups. Owned channels are the ones you control, such as your website and email list. Rented channels are social platforms where you post but don't control reach. Borrowed channels are other people's audiences, such as podcasts, newsletters, partners, and syndication. Earned channels are press and community mentions you don't pay for. AI answers are summaries from assistants and search features that may name or cite you.
Is it true that about 60% of Google searches end without a click?
Roughly, according to one widely cited study, but the figure depends on the method. SparkToro's 2024 study of a clickstream panel found that 58.5% of U.S. Google searches and 59.7% of EU searches ended without a click. Its 2026 study, using a different panel, reported 68%, and the author warned that the two years can't be compared. Google says total organic clicks have been relatively stable. Treat any single zero-click figure as an estimate tied to its method.
How does a zero-click marketing strategy work?
A zero-click marketing strategy puts the useful part of your content directly on the platforms where buyers read, so it works without a visit to your website. Teams publish native posts that teach the full idea, contribute to podcasts and newsletters, answer questions in communities, and keep public information accurate for AI answers. They measure the effect by asking buyers how they heard about the company and by watching branded search and sales conversations.
What are some examples of zero-click marketing?
Common examples of zero-click marketing include a LinkedIn document post that walks through a full framework in the feed, a founder's text post that argues one point with evidence, a podcast interview, a chart shared in an industry newsletter, and an answer in a professional community that solves the asker's problem. In each case the buyer gets the value where they are, and the company is remembered even if nobody clicks a link.
What is dark social in marketing?
Dark social is sharing through private channels, such as direct messages, internal chat tools, text messages, and email, that analytics tools can't attribute to a source. Alexis Madrigal coined the term in 2012. In B2B marketing it matters because buyers often pass content to colleagues privately, and those visits usually appear in analytics as direct traffic, or produce no visit at all when someone shares a screenshot or a quote.
How do you measure dark social traffic?
You can't measure dark social traffic completely, but you can estimate its effect. Watch direct visits to specific deep pages, such as reports and articles, since few people type those addresses by hand. Tag the links you control with campaign parameters so they don't fall into direct traffic. Most usefully, ask buyers how they heard about you in an open text field and in sales calls, and code the answers each month.
What is content syndication and how does it work?
Content syndication is republishing a full article, or a substantially similar version, on another site with the original publisher's permission, so the piece reaches that site's audience. To keep search engines showing your original, Google recommends that the partner block indexing of its copy with a robots meta tag rather than relying on a canonical tag. Agree on that, plus a credit and link to the original, before the partner republishes.