How to measure AI search visibility
A practical method for tracking brand mentions, recommendations, citations, referral visits, and outcomes across AI-generated answers.
22 min readWritten by Ampere

Contents
- How AI search visibility builds on search visibility
- What the major platforms currently expose
- Build the question set from customer needs
- A repeatable baseline audit for a small team
- Copyable AI search visibility tracking template
- Worked example: Juniper Trail’s first audit
- What the illustrative report can support
- Use each signal for the decision it can support
- When manual checks are enough
- Improve the evidence before chasing the score
Suppose someone asks an AI search product to recommend inventory software for a three-store retailer. Your company might appear by name in the answer. Its website might be linked as a source. The answer might recommend the product, describe it neutrally, or cite one of your guides while recommending somebody else. The person might click through, remember the name and return later, or never visit at all.
Each event answers a different question. Merge them into one metric and the report loses the distinctions that would make it useful.
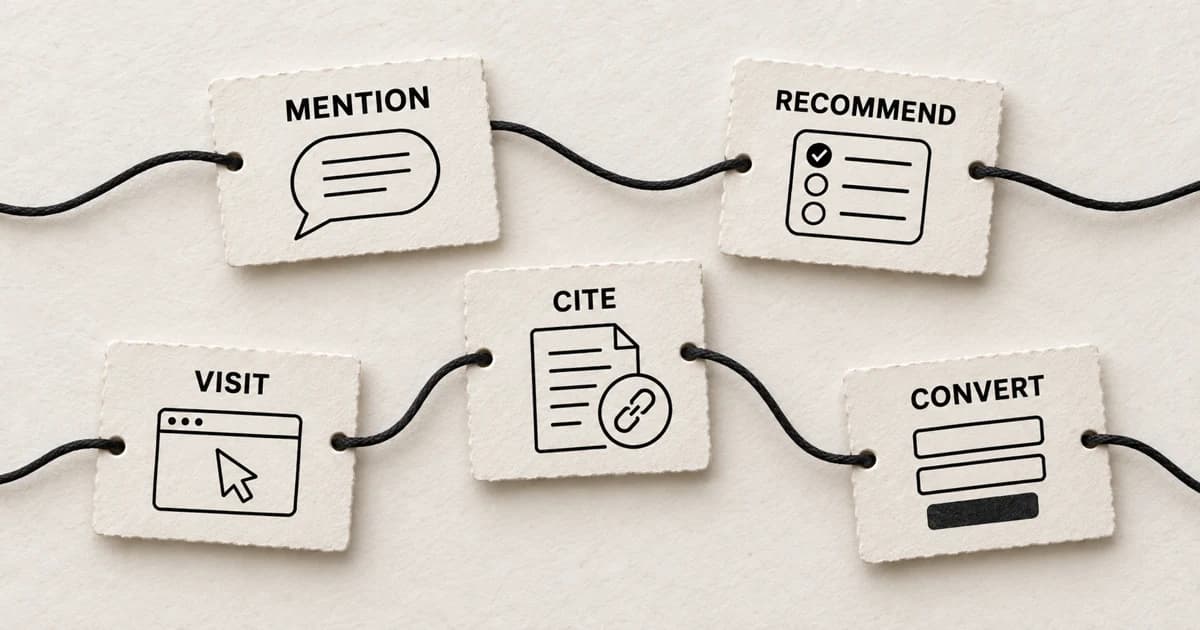
AI search visibility is the observable presence of a brand, product, or source in AI-generated answers for a defined set of questions and conditions. A useful measurement practice separates five signals: mentions, recommendations, citations, referral visits, and business outcomes. It also labels what came from platform reporting, what came from your analytics, what you observed in a sample, and what remains unknown.
The method below gives a small team a repeatable baseline audit, a copyable tracking template, worked calculations, and a completed fictional example.
How AI search visibility builds on search visibility
Traditional search visibility asks whether pages from your site appear in search results, where they appear, how often people see them, and whether those appearances lead to clicks. AI search adds another surface between the question and the visit: a generated answer that may synthesize several sources and name entities that it does not link.
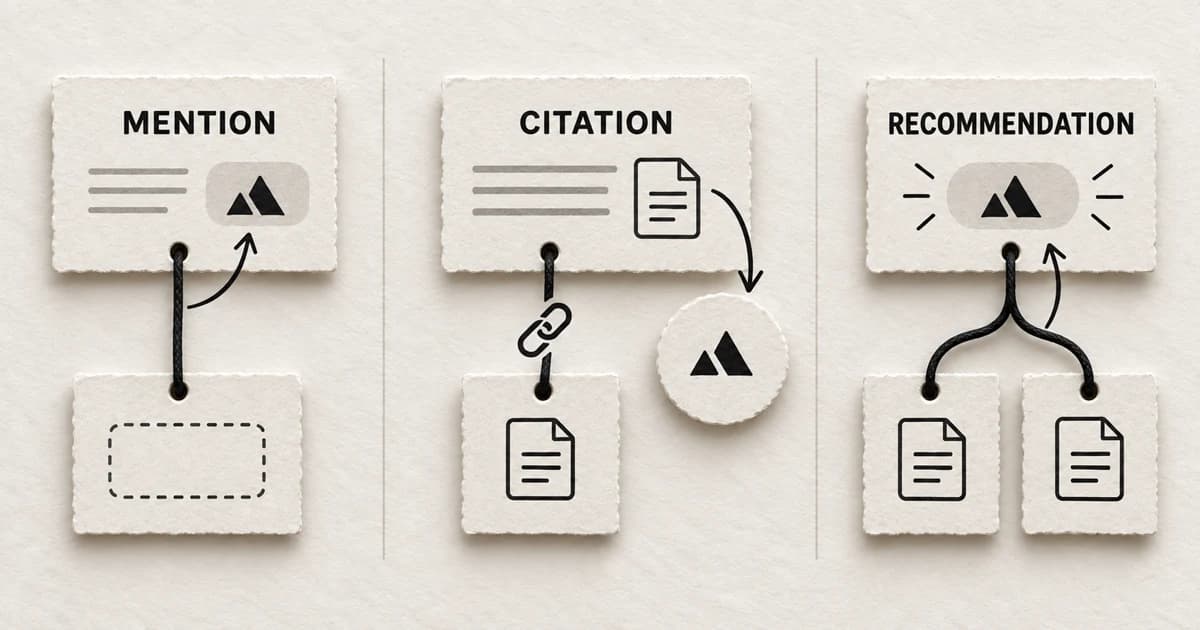
A generated answer creates several kinds of visibility. A brand can be present in the prose even when its site is absent from the source list. A useful article can be cited even when the answer does not recommend the company that published it. A linked source can receive no click. A person can encounter a brand in an answer, search for it later, and arrive through direct or branded search traffic that no analytics system can confidently connect to the earlier exposure.
| Signal | What you observed | What it does not establish |
|---|---|---|
| Brand mention | The answer named the brand or product | Endorsement, a citation, or a visit |
| Recommendation | The answer presented the brand as a suitable option for the stated need | That the recommendation was seen, trusted, or acted on |
| Citation | The answer displayed a link or source reference to a URL | A click, endorsement, or influence on a purchase |
| Referral visit | Your analytics recorded a session arriving from an identifiable AI source or tagged link | Every exposure, every later visit, or the visitor's full decision path |
| Conversion or inquiry | A measured visitor completed a defined business action | That one earlier AI answer caused the action |
The rows can overlap, and any one can appear without the next. Report them separately, then study where they overlap.
SEO, AEO, and GEO describe overlapping work
Search engine optimization (SEO) is the established work of making useful pages discoverable, understandable, and eligible to appear in search. Answer engine optimization (AEO) and generative engine optimization (GEO) are newer labels for work aimed at visibility in direct answers and generative search experiences.
The labels name useful areas of focus, although their boundaries remain unsettled. Google treats optimization for its generative search features as part of SEO and says its core search ranking and quality systems remain foundational. Its current guidance rejects the need for special AI schema, required content “chunking,” or a separate page for every possible fan-out query. The durable work is familiar: make pages crawlable, publish original and useful information, identify authorship and evidence, keep facts current, and make the page satisfying for the intended reader. See Google’s people-first content guidance and guide to generative AI features in Search.
Three technical terms help explain why measurement is different:
- Retrieval is the system finding pages or other sources that may help answer a question.
- Grounding is the system using retrieved material to support a generated answer. The terms are often used together because retrieved pages supply current evidence beyond what the model already contains.
- Query fan-out is the system issuing several related searches to answer one user question. Those retrieval queries may be narrower than the question the person typed, so record them separately from the original prompt.
That last distinction matters in reporting. A grounding-query phrase in Bing Webmaster Tools describes retrieval activity associated with a citation; the user's original prompt remains unreported.
What the major platforms currently expose
Each AI search product exposes its own slice of publisher data. Interfaces, retrieval behavior, citation treatment, and first-party metrics differ, so the source should travel with every number.
| Platform or experience | What affects the observation | First-party measurement available to site owners |
|---|---|---|
| Google Search: AI Overviews and AI Mode | AI Overviews appear within Search results; AI Mode supports follow-up questions and may fan one question into subtopics. Links shown inside these features follow Google Search impression and click rules. | Search Console's Generative AI performance report reports link impressions from AI Overviews and AI Mode by page, country, device, and date. Google says it was rolled out worldwide on August 31, 2026. The ordinary Performance report counts clicks on external links in these features, but its generative report documentation is centered on impressions and does not expose answer text or a complete prompt log. Search Labs experiments are excluded. |
| Microsoft Copilot, AI summaries in Bing, and selected partner experiences | Microsoft combines citation activity across several supported AI surfaces. The visible answer and cited pages may vary by experience. | Bing Webmaster Tools AI Performance reports total citations, average cited pages, page-level citation activity, trends, and sampled grounding-query phrases. Microsoft describes the feature as a public preview and says its data is aggregated, refreshed daily with a delay, and not a complete log. Preview additions include intent, topic, comparison, and citation-share views. |
| ChatGPT Search | Search may rewrite a question into one or more targeted queries. General location, memory, conversation context, and whether web search runs can affect the result. Answers may show inline citations and a Sources panel. | OpenAI documents publisher crawl controls and automatically adds utm_source=chatgpt.com to referral URLs from ChatGPT search results. Its current public publisher documentation does not describe a Search Console-style impression or citation dashboard, so teams generally combine referral analytics with manual or vendor-run samples. See OpenAI’s search documentation and publisher FAQ. |
| Perplexity | Perplexity answers are built around linked sources; search mode, selected model, location, account context, and follow-up history can change the source set. | Perplexity documents PerplexityBot for search discovery and Perplexity-User for user-requested fetches in its crawler documentation. The public documentation reviewed for this guide does not describe a publisher visibility dashboard comparable with Google or Bing. Use visible citations, identifiable referrals, and clearly defined manual or vendor samples. |
| Gemini and other AI assistants | Some experiences search the web by default, some only when asked, and some answer largely from model knowledge. Model choice, interface, account state, and tool availability can all change the response. | Keep data from a company's search product separate from its assistant app. Record the exact experience tested, then use its documented reporting if available; otherwise treat observations as a sample and referrals as partial outcome evidence. |
Those boundaries tell you what each report can support. Search Console can tell you that links from your site were shown in supported Google generative search features. Bing can tell you that pages were visibly cited across supported Microsoft experiences. Answer text and a universal cross-platform visibility score remain outside both reports.

Build the question set from customer needs
A baseline becomes useful when its questions represent decisions your audience actually makes. Start with evidence you already have: sales-call questions, support tickets, customer interviews, on-site search, Search Console queries, paid-search terms, community discussions, and the wording customers use in briefs.
Autocomplete suggestions and keyword-volume estimates can add ideas, and they supply different kinds of evidence. Autocomplete shows suggestions generated by a platform under particular conditions. A search-volume tool estimates search activity using its own data and method. An interview records what one person said. A prompt exported from an AI product records an observed question in that product. Keep the source labels to preserve those differences.
For a first audit, choose a set small enough that somebody will inspect every answer. Cover distinct jobs and skip dozens of near-duplicate phrasings:
| Question type | Example | What it tests |
|---|---|---|
| Branded | “What is Juniper Trail and who is it for?” | Whether the product is recognized and described accurately when named |
| Category | “What inventory planning software works for independent outdoor retailers?” | Whether the brand surfaces without being supplied in the question |
| Solution | “How can a three-store outdoor retailer reduce seasonal stockouts?” | Whether the brand appears when the user starts with a problem rather than a product class |
| Comparison | “How do retail planning tools compare with spreadsheets for seasonal buying?” | Which criteria and sources shape the comparison |
| Recommendation | “Recommend an inventory forecasting tool for a small outdoor retail chain.” | Whether the brand is presented as a suitable option under stated constraints |
| Alternative | “What are practical alternatives to enterprise retail planning software?” | Whether the brand enters an adjacent competitive set |
A branded question is a recognition and accuracy check. Supplying the name makes a mention easier, so report branded and non-branded results separately. Category and recommendation questions are more useful for discovery, while solution questions reveal whether your content connects the audience's problem to the category at all.
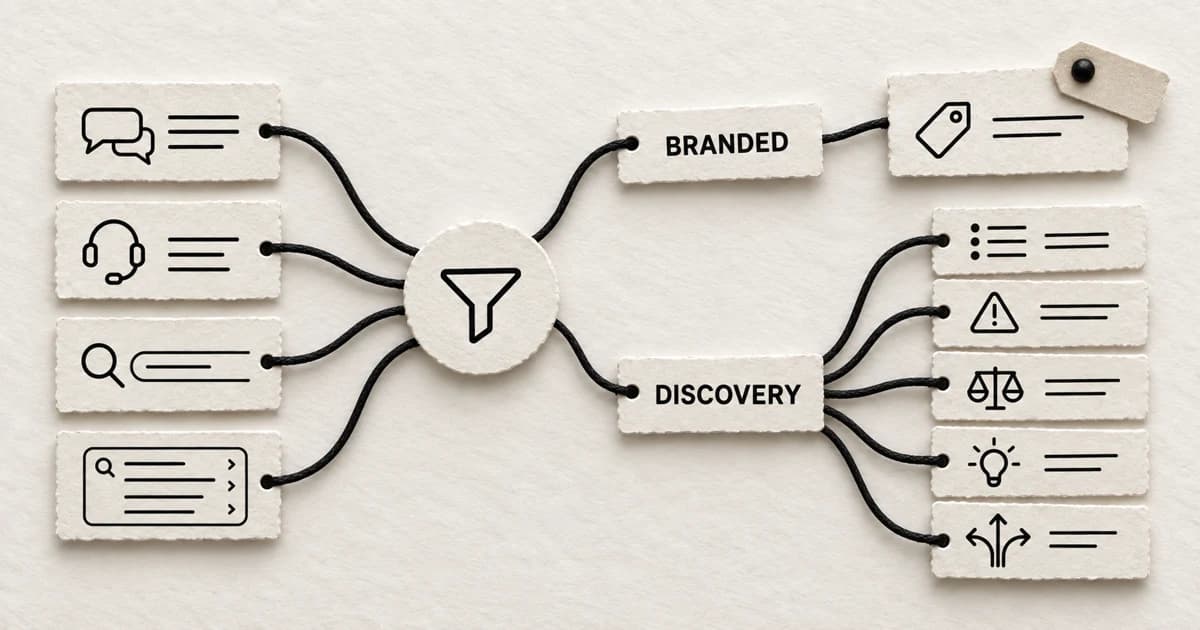
Use the question set as a measurement instrument. Group misses by the underlying need, then decide whether one genuinely useful page can answer that need better. A prompt variation alone is a weak reason to create another page.
A repeatable baseline audit for a small team
The following method works with a spreadsheet, access to the products you want to observe, and your existing analytics. It creates a documented baseline for the chosen sample and conditions, ready to rerun later under a comparable setup. Statistical representation falls outside the scope of this audit.
1. Define the decision before collecting answers
Write down what the audit should help you decide. A good first objective is: “Find the audience questions where we are absent, described inaccurately, or cited through the wrong page, then choose two content or technical investigations.” This is more actionable than “increase AI visibility.”
2. Select questions and preserve their sources
Choose questions across branded, category, solution, comparison, recommendation, and alternative intent. Keep the original wording when it came from a real source. In the tracker, give each source its own label: “sales call,” “customer interview,” “Search Console,” “support ticket,” “autocomplete,” or “editorial hypothesis.” The labels preserve differences in evidentiary weight.
3. Fix and record the test conditions
For every run, capture:
- platform and exact experience, such as “ChatGPT Search” rather than “GPT”
- date and, if useful, approximate time
- country or location setting, language, device, and account state
- model or mode when the product exposes it
- whether web search was enabled or visibly used
- fresh conversation or continued conversation
- relevant personalization, memory, or prior context
- repeat number
Some variation will remain. Record enough context to see it. A fresh conversation reduces carryover from the preceding exchange; the answer can still change between runs.
4. Run independent repeats
Repeated runs show whether an observation recurs under your chosen conditions. Start each repeat in a fresh conversation unless conversation history is the thing you are testing. Count every question-platform-repeat combination as one answer observation.
Repeat counts and cadence are practical choices. More repeats cost more time and reveal more variability; fewer repeats are cheaper and give each appearance more influence over the result. Choose a method your team can sustain, document it, and keep it consistent when comparing periods.
Recent preprints reinforce the need for restraint. One study of commercial recommendations found large differences between paraphrases of the same buying intent, and another found that repeated identical questions continued to surface new brands and sources across many runs. Their findings apply to particular models, categories, and test designs, so they cannot set a benchmark for your brand. They support a narrower conclusion: one answer is weak evidence of a stable pattern. See the paraphrase-brittleness study and repeated-query study.
5. Code the answer, then preserve the evidence
For each observation, record whether the brand was mentioned, whether it was actually recommended for the stated need, and every cited URL from your domain. Save a screenshot or exported answer with a stable filename, such as 2026-09-15-chatgpt-q03-r1.png, and put that reference in the tracker.
Read the answer alongside the source chips. A page can be cited while the brand is absent from the prose. A brand can be mentioned because a third-party page described it. Count a recommendation when the answer presents the brand as suitable for the stated need; an appearance in a comparison table alone does not qualify.
6. Add first-party reports and analytics separately
Export the relevant Google and Bing publisher reports when available. In website analytics, inspect session source or referrer for identifiable AI referrals and connect those sessions to meaningful actions such as a pricing-page view, signup, demo request, or purchase. Keep this as a separate table from manual observations because the denominators are different.
Google Analytics distinguishes first-user acquisition, session acquisition, and event-level attribution. For this audit, Session source / medium is usually the clearest starting point for visits: it describes what initiated that session. A later key event may receive fractional or modeled credit under the property's attribution settings. Describe it as an attributed conversion under those settings; causal credit requires more evidence. See Google’s documentation on traffic-source scopes and the Traffic acquisition report.
7. Report findings at the level the evidence supports
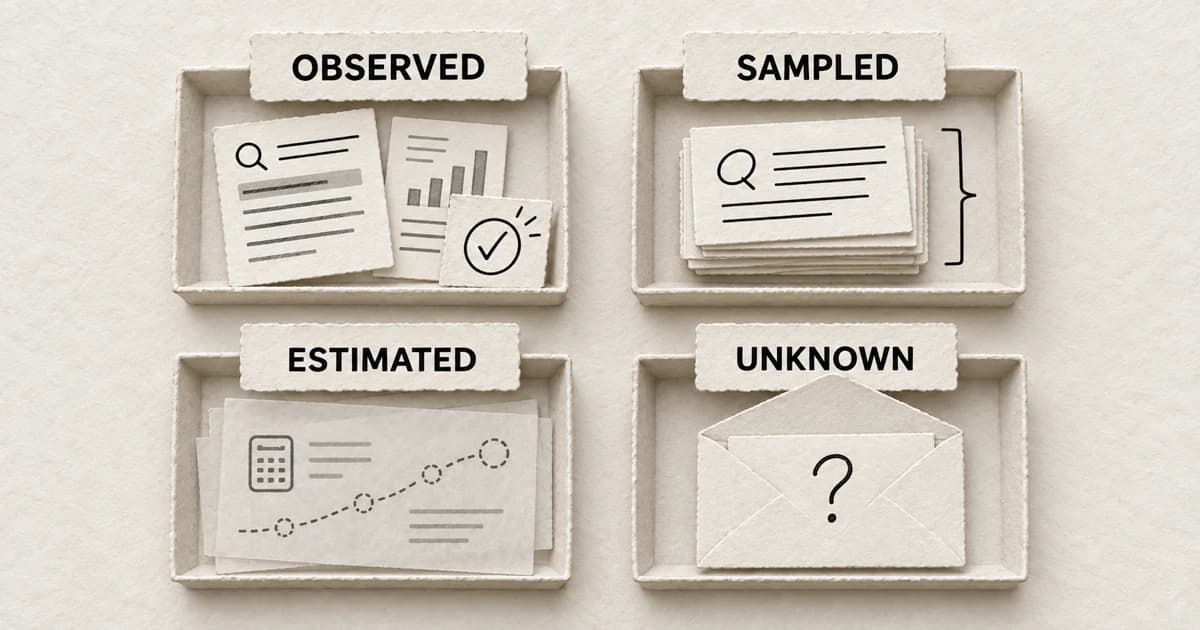
Separate four classes:
- Observed: a saved answer, a documented platform metric, or an analytics event you directly inspected
- Sampled: a rate calculated from your defined question-platform-repeat set
- Estimated: a vendor-modeled audience, impression, demand, or visibility figure
- Unknown: unreported exposures, later unattributed visits, the user's private context, and causal influence on a purchase
This vocabulary keeps a small audit honest and still gives the team something useful to act on.
Copyable AI search visibility tracking template
Keep enough fields to reproduce and interpret an observation. Internal notes can sit elsewhere if they would make the shared view unwieldy.
| Field | What to record |
|---|---|
| Question | Exact wording tested |
| Question source | Interview, sales call, support, Search Console, autocomplete, observed prompt, or editorial hypothesis |
| Platform and experience | Product plus mode, such as ChatGPT Search or Google AI Mode |
| Date | Date of the answer observation |
| Relevant test conditions | Country, language, fresh or continued conversation, search state, model/mode, and repeat number |
| Brand mention | Yes or no, based on the answer text |
| Recommendation | Yes or no, using your documented definition |
| Cited URL | Exact URL from your domain, blank if none |
| Evidence reference | Screenshot, export, or saved-answer identifier |
Download the CSV template and duplicate rows for every platform and repeat. A spreadsheet is enough until manual collection becomes the bottleneck.
Worked example: Juniper Trail’s first audit
The following business, questions, answers, and analytics are fictional and illustrative. They demonstrate the method with synthetic data; no real company or platform produced these results.
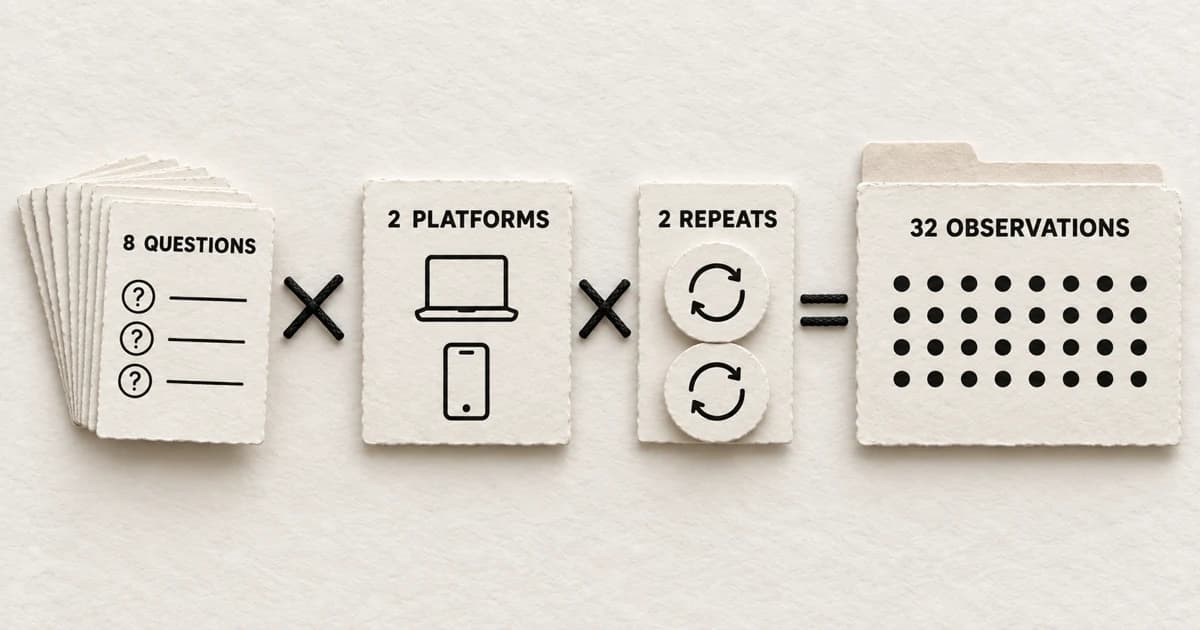
Juniper Trail is a fictional inventory-planning product for independent outdoor retailers. On September 15, 2026, its marketer tests eight questions in two experiences: ChatGPT Search and Perplexity Search. Each question is run twice in a fresh conversation, in US English, from Seattle, with no saved memory or prior conversation context. That creates:
8 questions × 2 platforms × 2 repeats = 32 answer observations
The illustrative question set
| ID | Question | Source used in the fictional audit |
|---|---|---|
| Q1 | What is Juniper Trail and who is it for? | Support ticket |
| Q2 | How does Juniper Trail compare with planning tools built for large retail chains? | Sales call |
| Q3 | What inventory planning software works for independent outdoor retailers? | Customer interview |
| Q4 | How can a three-store outdoor retailer reduce seasonal stockouts? | Customer interview |
| Q5 | How do retail planning tools compare with spreadsheets for seasonal buying? | Search Console query theme |
| Q6 | Recommend an inventory forecasting tool for a small outdoor retail chain. | Sales call |
| Q7 | How should an outdoor retailer plan seasonal buying across stores? | Support ticket |
| Q8 | What are practical alternatives to enterprise retail planning software? | Autocomplete suggestion |
Illustrative results by question
Each row summarizes four answer observations: two platforms multiplied by two repeats.
| ID | Mentions | Recommendations | Citations to junipertrail.example | What the saved answers support |
|---|---|---|---|---|
| Q1 | 4 of 4 | 0 of 4 | 3 of 4 | The fictional product was consistently recognized when named; one answer mentioned it without citing its site |
| Q2 | 4 of 4 | 3 of 4 | 2 of 4 | The brand appeared in every branded comparison, but one answer described it without recommending it and two cited only third-party sources |
| Q3 | 1 of 4 | 1 of 4 | 1 of 4 | One non-branded category answer recommended and cited the product; three did not mention it |
| Q4 | 0 of 4 | 0 of 4 | 0 of 4 | No observed connection between the stockout problem and the fictional product |
| Q5 | 1 of 4 | 0 of 4 | 1 of 4 | One answer cited the product’s spreadsheet guide without recommending the product |
| Q6 | 1 of 4 | 1 of 4 | 0 of 4 | One recommendation named the product but linked only to third-party sources |
| Q7 | 0 of 4 | 0 of 4 | 0 of 4 | No observed presence for the seasonal-buying how-to question |
| Q8 | 0 of 4 | 0 of 4 | 0 of 4 | No observed inclusion in the alternatives set |
| Total | 11 of 32 | 5 of 32 | 7 of 32 | A baseline sample, not population coverage |
The full 32-row illustrative dataset is included in the downloadable CSV after the blank template rows, so the totals can be checked observation by observation.
Mention rate and citation rate
For this audit, one answer observation counts once in the denominator. If an answer says “Juniper Trail” four times, it still contributes one mention. If it cites two Juniper Trail pages, it still contributes one cited answer to this rate; the individual URLs remain in the tracker for page-level analysis.
Sampled mention rate
answers that mention Juniper Trail ÷ all answer observations
11 ÷ 32 = 0.34375 = 34.4%
Interpretation: Juniper Trail appeared in 34.4% of this defined answer sample. Coverage across all real customer questions remains unknown.
Sampled citation rate
answers that cite at least one Juniper Trail URL ÷ all answer observations
7 ÷ 32 = 0.21875 = 21.9%
Interpretation: 21.9% of sampled answers displayed at least one URL from the fictional site. Clicks, endorsement, and recall use different denominators and remain unmeasured here.
The same data can be summarized at the question level: five of eight questions produced at least one mention, or 62.5%. This metric uses questions as its denominator. It shows breadth across needs while hiding inconsistency between platforms and repeats, so Juniper Trail should report it alongside the answer-level rate.
If the team later reports share of voice, it must define the competitive set and unit. One defensible sampled version is: Juniper Trail mentions ÷ mentions of all five predeclared brands across the same 32 answers. Changing the competitor list changes the denominator and therefore the score.
Illustrative referral and outcome data
For the 30 days ending September 15, the fictional company’s analytics show nine identifiable sessions from chatgpt.com or perplexity.ai. Four were engaged sessions, two reached the pricing page, and one submitted a demo request.
Those are observed website events in this fictional example. They belong to a separate dataset from the 32 manual answer observations. The analytics also miss people who saw the brand and returned later through search, copied an untagged URL, blocked analytics, or converted on another device. A careful report would say: “One demo request occurred in a session attributed to an identifiable AI referral.” Claiming that the sampled visibility generated the demo would overstate the evidence.
What the illustrative report can support
Here is the short report Juniper Trail could send to its founder.
Illustrative AI search visibility baseline — September 15, 2026
Juniper Trail appeared in 11 of 32 sampled answer observations (34.4%) and its site was cited in 7 (21.9%). Presence was concentrated in the two branded questions: eight of the 11 mentions occurred after the question supplied the name. Among six non-branded questions, the brand appeared in three of 24 observations. The clearest content gap is problem-led discovery: none of the four answers about reducing seasonal stockouts connected the need to Juniper Trail. One spreadsheet-comparison answer cited the company’s guide while recommending another product. That result separates source visibility from product recommendation.
In a separate 30-day analytics view, nine identifiable sessions arrived from ChatGPT or Perplexity and one produced a demo request. Those visits come from a separate dataset, leaving total AI exposure and causal impact on pipeline unknown.
Next: verify whether the stockout and seasonal-buying pages are crawlable and current; compare the cited spreadsheet guide with sources used in the missed answers; interview two customers about how they describe seasonal stockouts; then improve the strongest existing page if the gap is real. Repeat the same baseline conditions after the work has had time to be discovered, while logging platform or model changes.
The report points to an investigation. Before creating content, Juniper Trail should inspect whether a useful page already exists, whether the missed question belongs to its audience, and whether the answer would add something more helpful than a product pitch.
Use each signal for the decision it can support
Different measurements answer different questions:
- Mentions and recommendations in a defined sample can reveal recognition, category inclusion, description errors, and needs where competitors recur but you do not.
- Cited URLs can show which of your pages are being used as sources and which third-party pages frame the category. Inspect the actual passage and answer before deciding that the cited page is “winning.”
- Google generative impressions can show whether links from your property were displayed in supported Google generative search features, broken down by page and selected dimensions.
- Bing citation activity and grounding-query groups can show which pages and themes are associated with citations across supported Microsoft experiences. The report itself says the data is sampled and does not indicate ranking, authority, or a page's role in an answer.
- Referral sessions and key events can show observable visits and downstream actions. Segment by landing page and intent, not just source, to learn whether visits are qualified.
- Customer and sales evidence can tell you whether the audited questions resemble real buying work. It often improves the question set more than another hundred generated prompts.
A vendor score summarizes its sample. Citations record displayed sources, while referral analytics count identifiable sessions. A content edit needs stronger causal evidence than a before-and-after score. Model updates, demand shifts, indexing changes, location, language, personalization, search availability, and ordinary output variation remain plausible explanations.
Third-party tools can still be useful. Their methods simply need to travel with their numbers. Ahrefs, for example, defines mentions and citations at the answer level, derives its prompt set from search-backed questions, and models “impressions” using Google search-volume data. Semrush uses its own prompt collection and visibility formula. Profound’s current documentation says its main visibility score uses non-branded prompts. These are product-specific constructs with different scales. Review the vendor’s prompt source, platform coverage, counting rules, and formula before comparing periods. Compare scores only within the same documented methodology.
When manual checks are enough
Manual checks are enough when your question set is still being designed, the team serves one market and language, and somebody can inspect every answer. They are especially valuable at the start because reading the responses teaches you what the binary fields miss: a recommendation may be qualified, a mention may be inaccurate, and a citation may support only one sentence.
A paid visibility tool becomes useful when the collection work is crowding out analysis. Common triggers include monitoring several markets or languages, tracking a stable question set across multiple platforms, preserving answer history, comparing a defined competitor set, or needing alerts and exports for a regular reporting process.

Question design still belongs to your team. Before subscribing to a tool, ask:
- Where do its prompts come from, and can you add questions grounded in your own audience evidence?
- Which exact platform experiences, models, locations, and languages does it test?
- How often does it run, how many repeats does it make, and can you inspect the underlying answers?
- How does it count a mention, recommendation, citation, position, impression, and share of voice?
- Does it preserve historical evidence when models or product interfaces change?
- Can you export the raw observations as well as the composite score?
Keep a small manual control sample even after adopting a tool. It gives you a way to notice changed definitions, mislabeled brands, broken prompts, or a score movement that disappears when you read the answers.
If the audit itself becomes a recurring operation, schedule the collection only after the questions, definitions, and review rules are stable. The guide to automating marketing with AI agents explains how to separate a repeatable trigger from the judgment that still needs a marketer.
Improve the evidence before chasing the score
A first audit will usually leave more unknowns than a traditional rankings report. The boundary shows where the team has evidence and where the market remains opaque.
Start with the gaps that connect to real audience needs. Check crawl and indexing access. Correct inaccurate entity information. Strengthen a useful existing page with original evidence, a clear answer, real examples, and current facts. Make important claims independently verifiable. Then repeat the same sample and compare the underlying answers, cited pages, first-party reports, referrals, and qualified actions.
A useful outcome is a report that shows a founder what was observed, sampled, estimated, and left unknown, with enough context to choose the next content decision.