How to measure the ROI of AI in marketing (hours saved is the wrong number)
An estimate of hours saved can't show what a marketing team's AI spend returned. Learn to price approved work at its full cost, compare it with a baseline, and report the return as a range, with seven formulas, a worked example, and a one-page report you can copy.
43 min readWritten by Ampere
Short answer
How do you measure the ROI of AI in marketing?
Measure the ROI of AI in marketing by pricing approved work at its full cost, including setup and review time, and comparing it with how the same work was done before. Count cash savings and freed hours the team can show it used, add outcomes only from a fair comparison, and report ROI and payback as a range, because the value of freed time depends on how it was used.
Summary
Hours saved is a weak measure of what AI returns to a marketing team, because it is usually an estimate, counts effort rather than approved work, leaves out review time, and ignores where the time went. In a 2025 randomized trial, developers believed AI had sped them up after it had slowed them down. Approved work priced at full cost against a baseline holds up better.
Surveys published in 2025 and 2026 put the share of organizations or initiatives seeing a return on AI anywhere from 5% to 74%, because they define a return, choose respondents, and set time windows differently. None of them gives a team its own return, which starts with the full cost of the work, including setup, review, and rework time at a loaded hourly rate.
Seven metrics cover what a budget review asks about AI work: cost per approved asset, time to first usable draft, review minutes, first-pass acceptance, revision rounds, coverage of recurring work that was used, and links to outcomes. A baseline comes from 8 to 12 weeks of records and a two-week time log. Counting only approved work, with blind rubric scoring of a sample, stops extra volume from inflating the result.
AI value comes in three kinds: cash savings, freed hours put to named use, and outcome gains measured against a comparison group. Counting both the freed hours and the work they produced counts the same time twice. A conservative ROI that counts only cash savings, reported beside an expected ROI and a payback period, shows how much of the return rests on judgment.
In a worked example with illustrative numbers, a fictional software company's estimate of hours saved suggests a return of about 620%, while its measured return for the quarter, including setup and review, is 3% to 43%, and one workflow costs more than before. A one-page report template ends with a keep, expand, fix, or stop decision for each job, measured by quarter because the first month usually looks worse.
Contents
- Why hours saved is the wrong number for AI ROI
- What surveys say about AI ROI, and why the figures disagree
- What AI really costs a marketing team
- The AI ROI metrics, with formulas
- How to set a baseline before the rollout, or rebuild one after
- How to adjust AI output for quality
- How to link AI work to business outcomes
- How to calculate AI ROI and payback as a range
- Worked example: one quarter of AI work at a fictional software company
- How to report AI ROI to a CEO or board
- Template: a one-page AI ROI report
- Common mistakes when measuring AI ROI
- How to measure the return on Ampere work
- Sources and further reading
- Frequently Asked Questions
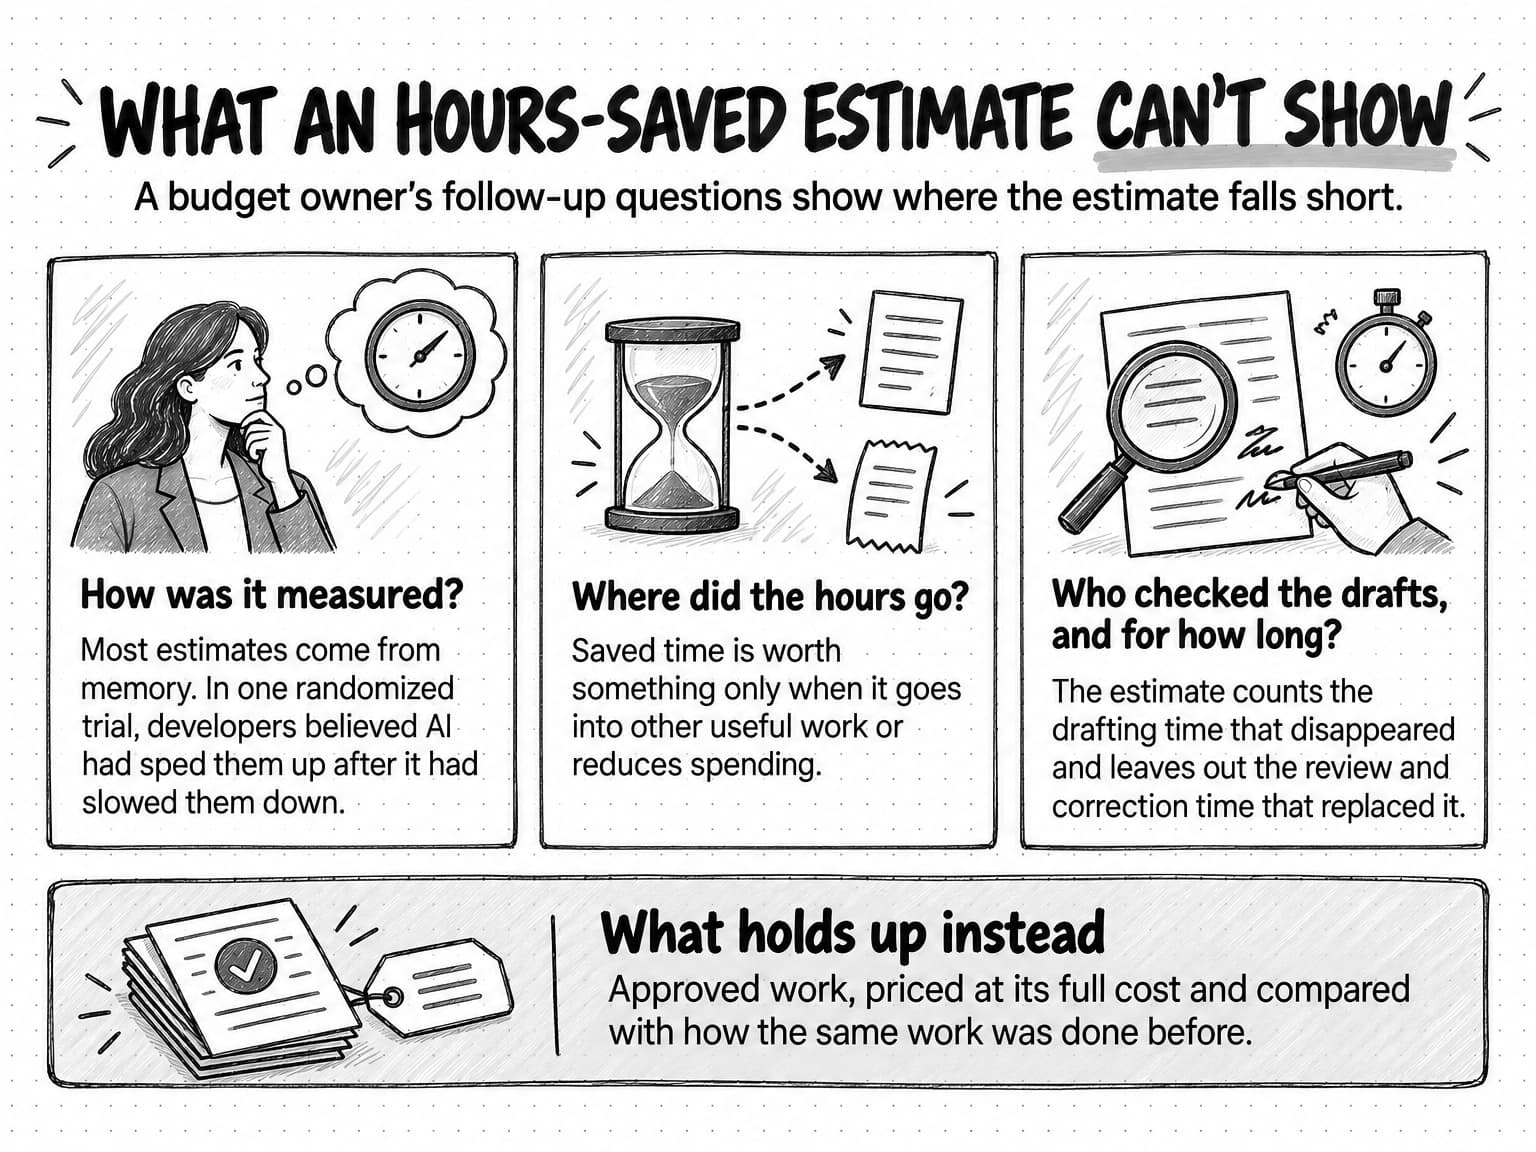
Sooner or later, a CFO reviewing renewals, a CEO preparing for a board meeting, or a head of marketing defending next year's plan asks what the team's AI spend has returned. The easiest answer is an estimate of time saved, such as ten hours a week across the team, and it rarely survives the follow-up questions. How was the ten measured? Where did the hours go? Who checked the drafts, and for how long? Did the team publish more, spend less on freelancers, or win more business?
The ROI of AI in marketing is the value that AI-assisted work adds, minus everything that work costs, divided by that cost, and measured against how the same work was done before. Each follow-up question tests one part of that definition. The time spent checking the drafts belongs to the cost, along with subscriptions and usage. Where the hours went, and whether the team published more, spent less, or won more, belongs to the value. How the ten was measured depends on the baseline, a record of the old way of doing the same work, which is what turns a sense of speed into a change you can measure.
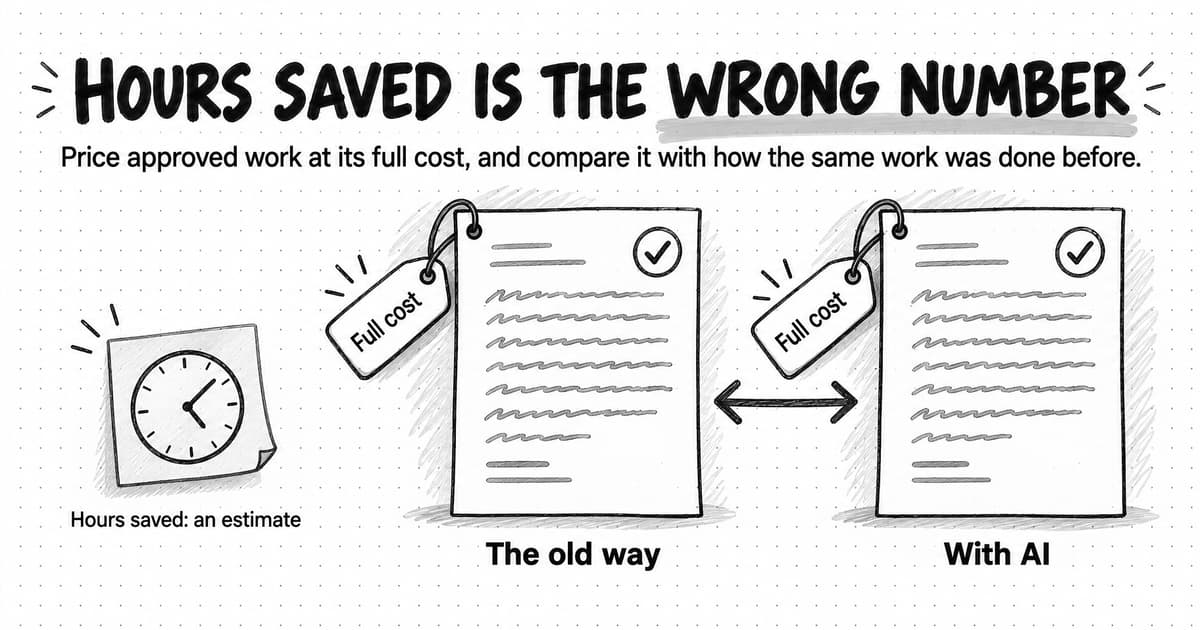
An estimate of hours saved fails that definition. It usually comes from memory, it counts effort going in instead of approved work coming out, it leaves out review and correction time, and it says nothing about where the hours went. A measurement that holds up prices the approved work at full cost and compares it with the baseline, whether the team uses a chat assistant, a point tool for images, or an AI marketing agent.
This guide defines seven metrics with formulas, explains how to set a baseline or rebuild one after a rollout, values saved time without counting it twice, and turns the results into an ROI and payback period stated as a range. A worked example follows one quarter at a fictional software company, and a one-page report template closes the method. ROI here is a management measure for decisions about tools and workflows, not an accounting or tax treatment.
Why hours saved is the wrong number for AI ROI
Time saved is the outcome marketers most often say they want from AI. In the 2025 State of Marketing AI Report from the Marketing AI Institute and SmarterX, 82% of respondents named reducing time spent on repetitive, data-driven tasks among their organization's primary goals for AI, ahead of accelerating revenue growth (63%), better campaign ROI (58%), and lower costs (52%). The survey ran from February to April 2025, drew 1,847 answers to that question, and was promoted through the institute's own channels, so its authors caution that respondents may be further along with AI than the industry as a whole.
The first problem is the estimate itself. In a randomized trial in early 2025, the research organization METR had 16 experienced open-source developers complete 246 real tasks, with AI tools allowed or disallowed at random for each one. The developers expected AI to cut their time by 24%. With AI allowed, tasks took 19% longer, and afterward the developers still believed AI had made them about 20% faster. The trial covered software work with early-2025 tools, and METR's February 2026 update said current tools probably speed developers up more, while repeating that self-reported speedups can be quite unreliable. An estimate of hours saved can point the wrong way and still feel right.
The second problem is where the time goes, because saved hours are worth something only when they go into other useful work or reduce spending. In a nationally representative US survey from November 2024, Alexander Bick, Adam Blandin, and David Deming found that generative AI users reported saving 5.4% of their work hours, about 2.2 hours of a 40-hour week, and noted that saved time spent as on-the-job leisure would not raise productivity. Economists Anders Humlum and Emilie Vestergaard surveyed about 25,000 Danish workers in 11 occupations exposed to AI chatbots, marketing professionals among them, and linked the answers to official records of earnings and hours. In the March 2026 revision of their NBER working paper, 85% of chatbot users said they moved saved time into other job tasks, and about 30% spent more time on the same tasks. Yet in records through December 2024, two years after AI chatbots arrived, the researchers found no effect on earnings or recorded hours, with estimates precise enough to rule out effects larger than 2%.
The same gap shows up in company results. In McKinsey's August 2026 survey of 1,719 participants in 97 countries, 80% of those using AI at work said it had improved their own productivity, while 37% reported any contribution from AI to their organization's operating profit.
The third problem is what the estimate leaves out. It measures effort, so it can't say whether the drafts were approved, used, or any good, and it counts the drafting time that disappeared while ignoring the review and correction time that replaced it. When a draft looks finished but isn't, the work lands on whoever receives it, a pattern researchers have named workslop. A team that saves four hours of drafting and then spends three checking and fixing the drafts will still report four hours saved.
View the hours-saved questions at full size (opens in a new tab).
Hours saved is still a fair question to start from, and the rest of this guide builds the records that answer it: the approved work, its full cost, and the old way of doing the same job.
What surveys say about AI ROI, and why the figures disagree
A CEO asking about AI returns has often seen a headline figure first, and the headlines contradict each other. In the large reports below, published between January 2025 and September 2026, the share of organizations or initiatives seeing a return runs from 5% to 74%. Most of the spread comes from what each one counted as a return and whom it asked.
| Publisher and date | Who was asked, and how | What counted as a return | Headline finding |
|---|---|---|---|
| MIT NANDA, July 2025 | Interviews at 52 organizations, a survey of 153 senior leaders at four industry conferences, and a review of more than 300 public AI initiatives, January to June 2025; labeled preliminary | Measurable impact on productivity or profit and loss six months after the pilot | 95% of organizations getting zero return from generative AI |
| BCG, September 2026 | 1,330 senior executives in more than 60 countries; self-reported | Being in its two most mature groups, scored on 41 self-assessed AI capabilities | 7.5% in the most mature group and 41% in the next, almost half generating value |
| McKinsey, August 2026 | Online survey of 1,719 participants in 97 countries, May and June 2026 | The share of EBIT, a measure of operating profit, attributed to AI | 37% report any EBIT impact, about the same share as a year earlier |
| IBM Institute for Business Value, May 2025 | 2,000 CEOs in 33 countries, February to April 2025, with Oxford Economics | AI initiatives that delivered the expected ROI over the last few years | 25% of initiatives |
| Deloitte, January 2025 | 2,773 leaders at organizations with at least one AI implementation in daily use, July to September 2024 | The most advanced generative AI initiative, judged against ROI expectations | 74% meeting or exceeding expectations |
| Wharton Human-AI Research and GBK Collective, October 2025 | 801 decision makers at US companies with 1,000 or more employees and more than $50 million in revenue, in a 15-minute online survey, June and July 2025 | ROI to date, judged from internal conversations with colleagues and senior leaders | 74% report positive ROI |
| Deloitte, October 2025 | 1,854 executives in Europe and the Middle East, August and September 2025 | How long a typical AI use case takes to pay back | Two to four years is typical; 6% report payback in under a year |
The studies define a return differently. Meeting an expectation is a lower bar than a measurable change in profit, and an impression formed in conversation is weaker evidence than a figure from the accounts. Grouping can move a headline too. BCG's headline figure went from 5% of companies achieving value at scale in its 2025 study of more than 1,250 firms to almost half generating value in 2026, but the 2026 figure combines its two most mature groups, which held 40% of companies the year before. The studies also ask different people. Deloitte's January sample included only organizations already using AI every day, and in the Wharton survey, respondents at vice-president level and above were more optimistic than mid-level managers, 81% against 69%. And the windows differ. MIT NANDA judged results six months after a pilot and acknowledged that this may understate longer-term success, while in the October Deloitte study a typical AI use case took two to four years to pay back, against seven to twelve months for a typical technology investment.
Two findings bear on marketing in particular. In McKinsey's 2026 survey, revenue increases were reported most often for AI in marketing and sales, though most of those increases were 5% or less. MIT NANDA found that sales and marketing attract much of the budget partly because their outcomes are easy to measure, a pattern its authors say "reflects easier metric attribution, not actual value." Marketing work is visible and countable, which makes it easy to measure activity and mistake it for a return.
None of these figures tells a team its own return. Quoting the friendliest one invites the question of how it was measured, which a figure built with the method below can answer.
What AI really costs a marketing team
An ROI figure needs a denominator, and for AI it is larger than the software bill. The cash part is easy to collect: subscriptions, usage charges, other AI tools such as image, video, or voice generators, and any outside help with setup. The time part is often larger, and an estimate built from the software bill leaves it out entirely.
Time costs come in two kinds. Setup and upkeep are the investment, such as writing the brand context and examples the tools need, building briefs and templates, testing, training, and later updating the context and repairing what breaks. Running time is the work of producing each piece, from briefing and prompting to review, revision, and fixes, including drafts that were thrown away. The table shows where each cost goes, so that setup is counted once and in the open.
| Subscriptions, usage, and other AI tools | The AI cost for the period. Also allocated to each job, from usage records where available, for cost per approved asset. |
|---|---|
| Setup and upkeep time | The AI cost for the period, at the loaded hourly cost, and kept out of cost per approved asset so it is counted once. |
| Running time | Cost per approved asset, including time spent on rejected drafts. |
| Outside spend | Cost per approved asset in both periods, such as freelancers, agencies, and stock services. Spending that stops is a cash saving. |
Price hours at a loaded hourly cost, meaning wages plus benefits and payroll costs, divided by hours worked. In the US Bureau of Labor Statistics release for June 2026, private employers paid an average of $46.89 an hour in total compensation, of which wages were $32.82 (70%) and benefits $14.07 (30%), so total compensation ran about 43% above wages. Ask finance for the rate it uses, because a figure finance chose is one finance will accept. The worked example here uses an illustrative $60 an hour, the same rate as our explainer on AI tokens and credits, which also covers how usage is priced and why a usage bill leaves out review time and the cost of failed runs.
Count every tool used for the work, including subscriptions teammates expense personally and tools bought for one campaign and never cancelled. Paying twice for the same job is a stack problem, which our guide to building an AI marketing stack takes on. The comparison of general-purpose AI assistants and AI marketing agents lists the costs to count beyond the subscription price.
The AI ROI metrics, with formulas
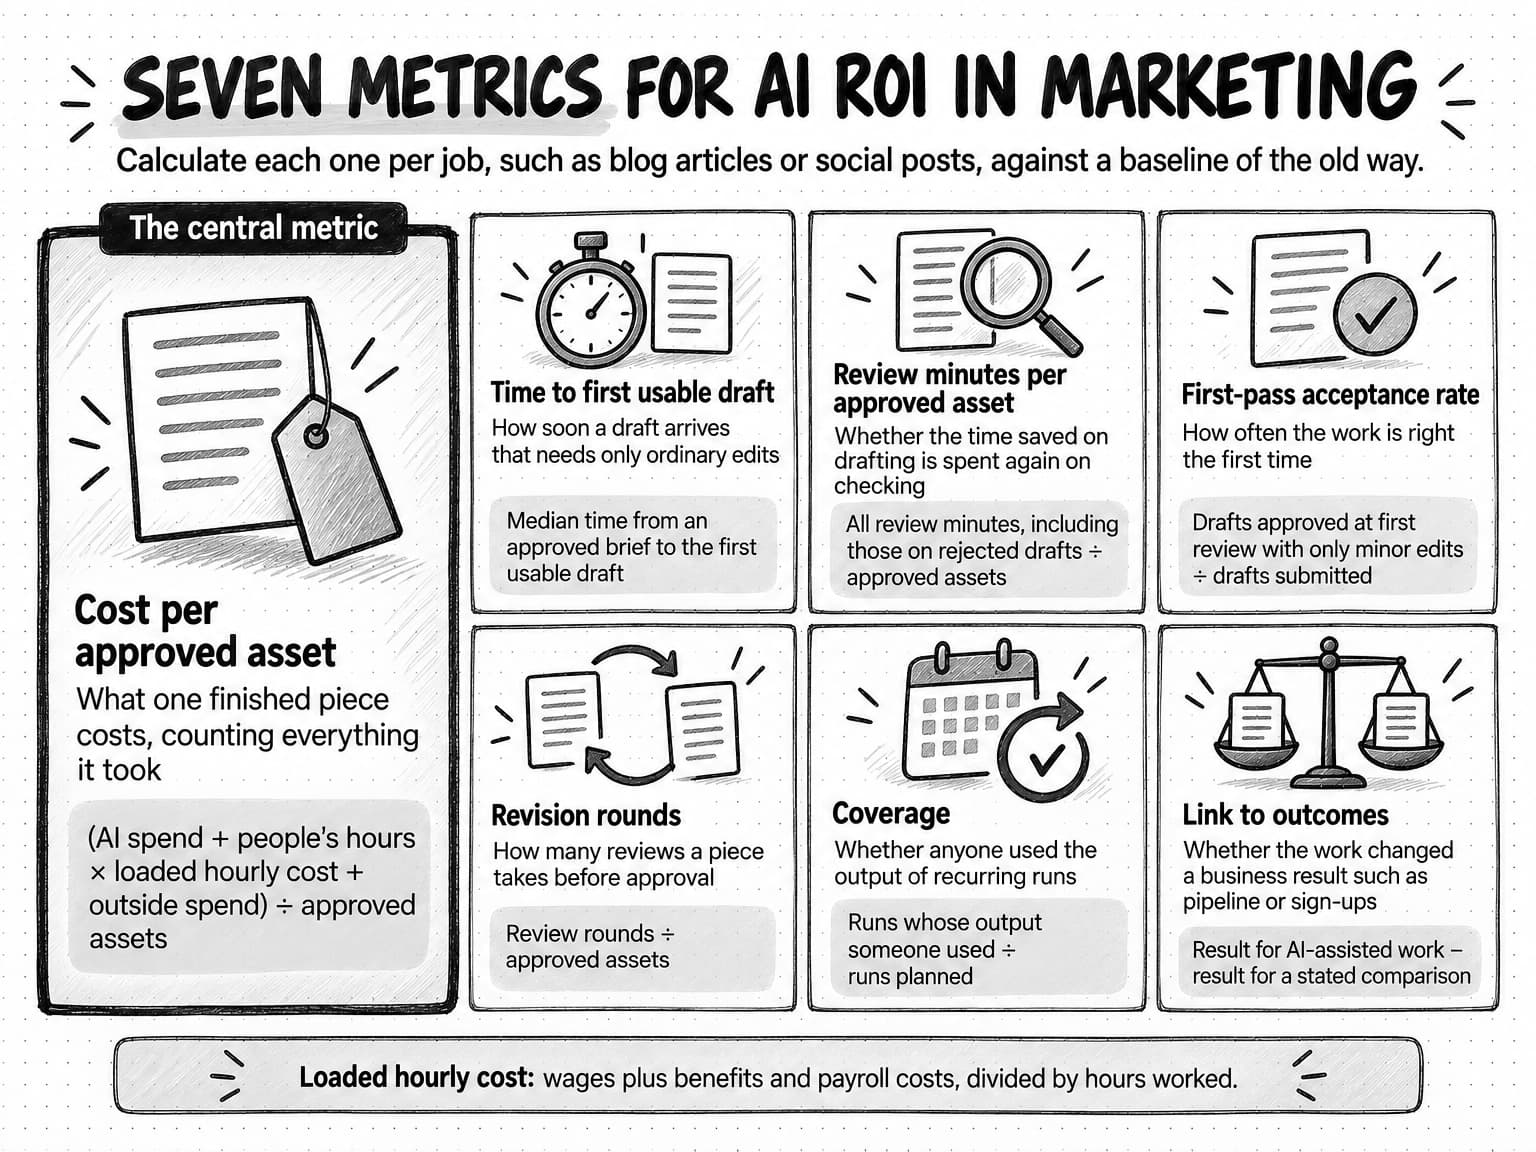
Seven metrics answer the questions a budget review asks about AI work, using records most teams have or can start keeping this week: a content tracker, invoices and AI bills, review dates, and a simple time log. Calculate each one per job, such as blog articles or social posts, because an article and a post are different units of work. In every formula, an approved asset is one finished piece, such as a post, an article, or an email, that passed review and was cleared for use. Each metric below comes with its formula, the records behind it, and the trap that most often distorts it.
View the seven AI ROI metrics at full size (opens in a new tab).
Cost per approved asset
Cost per approved asset = (AI spend for the job + people's hours on the job × loaded hourly cost + outside spend for the job) ÷ approved assets
This is the central metric, because it prices a finished piece that passed review and counts everything it took. People's hours cover briefing, prompting, reviewing, revising, and fixing, including hours spent on rejected drafts. AI spend for the job is its usage plus a share of subscriptions, allocated by usage records or by each job's share of hours, with the same rule in every period. The trap is leaving out rejected drafts and review time, which makes AI work look cheaper than it is. Our guide to choosing an AI model by task uses the same unit, called cost per accepted deliverable, to compare models on one job.
Time to first usable draft
Time to first usable draft = median elapsed time from an approved brief to the first draft a reviewer judges usable with ordinary edits
Take the dates from the brief approval and the reviewer's first usable mark, and report the median so one stalled piece doesn't distort the result. Define "usable" in advance, for example as needing line edits but no change to structure, audience, or claims. Keep elapsed time separate from people's working time, as the guide to evaluating an AI marketing agent does, because a draft that arrives in ten minutes and takes two hours to fix is fast and expensive at once. The trap is treating speed as savings. A faster draft helps when someone is waiting for it, but it saves money only if people's time per approved asset falls too.
Review minutes per approved asset
Review minutes per approved asset = minutes people spend reading, checking, and correcting drafts, including drafts later rejected ÷ approved assets
AI moves effort from writing to checking, so review time often rises as drafting time falls, and this metric shows whether the trade pays. Take it from a log, because nobody remembers short review sessions accurately; a shared sheet with the piece, the person, the date, and the minutes is enough. Where review should happen and how deep it should go are design questions that our guide to human-in-the-loop review covers, and this metric measures the result. The trap is assuming less review is always better, since review time also falls when reviewers stop checking closely, and only a quality check on a sample tells the two apart.
First-pass acceptance rate
First-pass acceptance rate = drafts approved at their first review with only minor edits ÷ drafts submitted for review
This shows how often the work is right the first time, which is what keeps review light. Define a minor edit before measuring, for example a change that takes under ten minutes and doesn't alter a claim, the structure, or the call to action. A rising rate usually means the brief, the saved context, or the method has improved. The trap is a slipping standard, since reviewers who see many acceptable drafts tend to check less closely, so read the rate beside a periodic quality score.
Revision rounds
Revision rounds = review rounds for approved assets ÷ approved assets
A round is one review, so a piece approved at its first review takes one round, and each return for changes adds another. Rounds show where work bounces, and three rounds on every newsletter usually mean the brief or the saved context lacks something the reviewer keeps supplying by hand. Count them from review dates or the document's comment history. The trap is that a single round can hide a rewrite, so read rounds together with review minutes.
Coverage
Coverage = recurring runs whose output someone used ÷ runs planned for the period, plus a named list of new work that now happens and was skipped before.
Some of the value of AI comes from work a small team never had time for, such as a weekly competitor summary or a second version of each article for another audience. Coverage counts that work only where it was used, meaning acted on, cited in a decision, forwarded to sales, or published, with a record such as a reply or a link in a deal record. The trap is counting runs. As our guide to automating marketing with AI agents puts it, a job that completed 40 times says little about whether anyone used the output.
Link to outcomes
Link to outcomes = the result for AI-assisted work − the result for a stated comparison, with the method and period named
This connects the work to pipeline, sign-ups, conversion, or retention. It is the most persuasive metric and the hardest to establish, because AI usually changes how work is made rather than what it says or where it appears. The section on outcomes below explains which evidence supports it.
How to set a baseline before the rollout, or rebuild one after
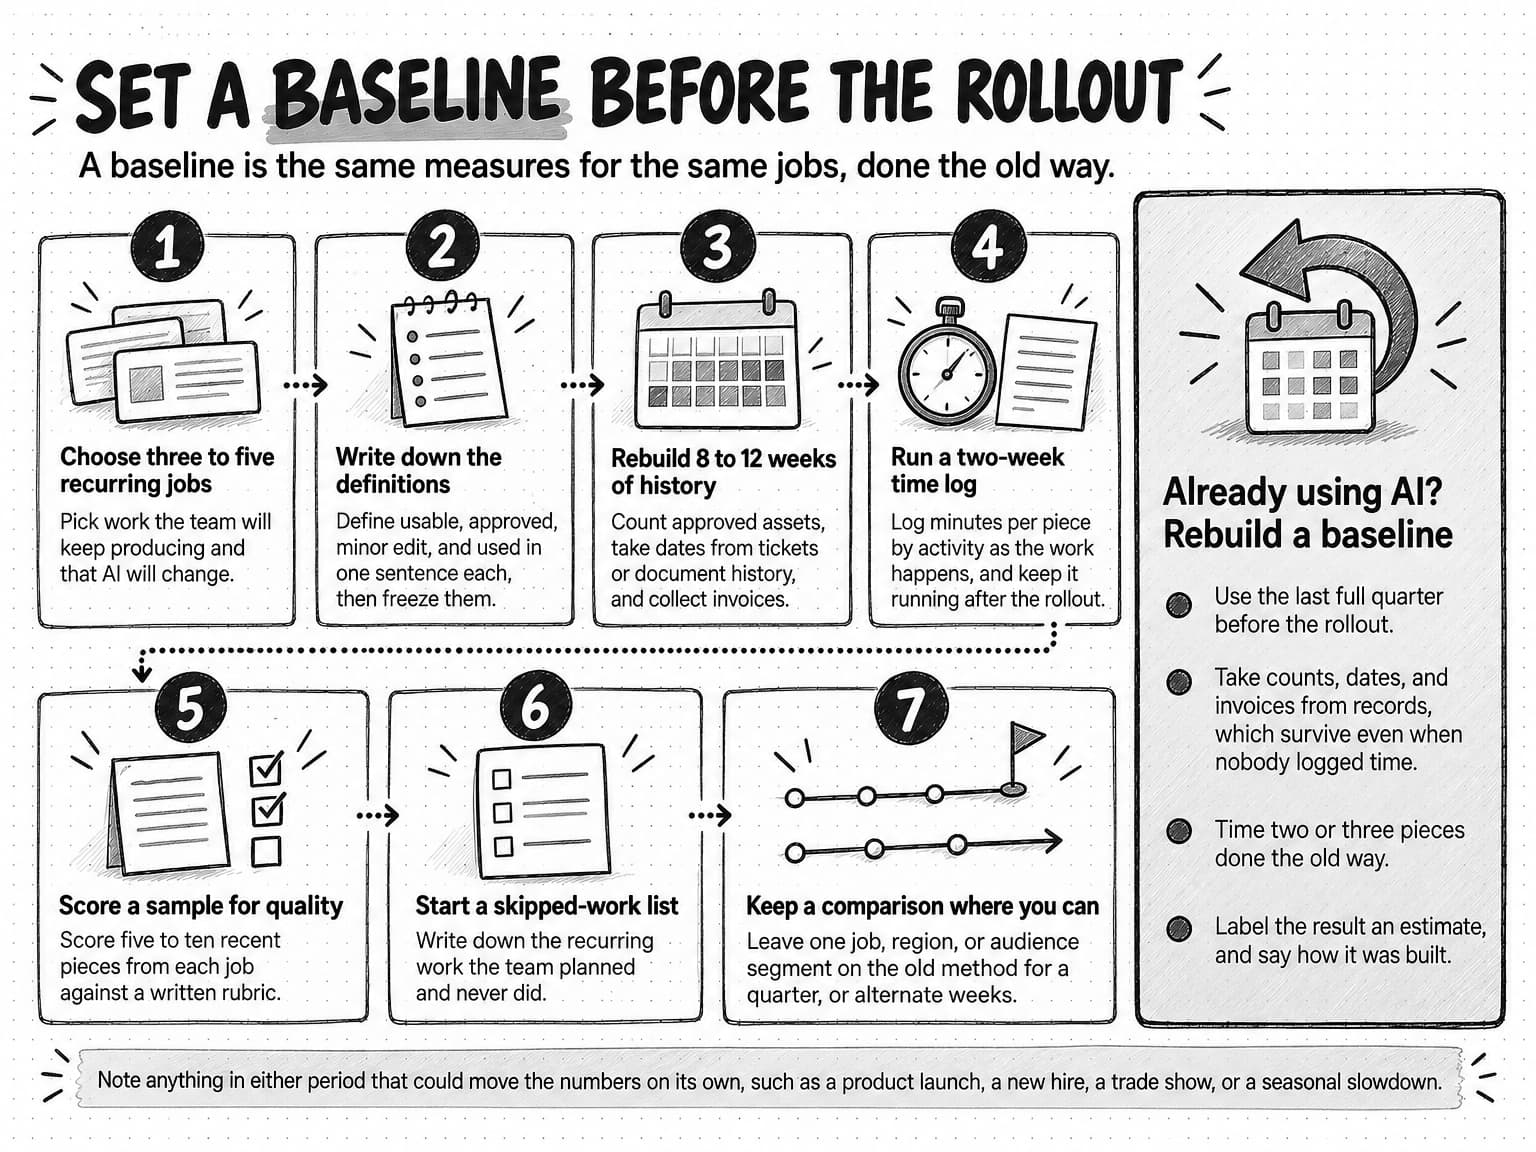
Every metric above means something only against a baseline, which is the same measures for the same jobs done the old way. Set it before a rollout if you can. If the tools are already in use, you can rebuild one from records, with less confidence.
- Choose three to five recurring jobs. Pick deliverables the team will keep producing and that AI will change, such as blog articles, LinkedIn posts, the newsletter, and sales one-pagers. One-off projects give you nothing to compare.
- Write down the definitions. Define "usable", "approved", "minor edit", and "used" in a sentence each, and freeze them for the measurement period so that the results mean the same thing to everyone who reads them.
- Rebuild 8 to 12 weeks of history. Count approved assets from the publishing calendar or content tracker, take dates from tickets or document history, and collect invoices for freelancers, agencies, and tools.
- Run a two-week time log. Ask everyone involved to log minutes per piece by activity, such as briefing, drafting, reviewing, and revising, as the work happens and in 15-minute blocks if finer detail is too much to ask. Keep the same log running after the rollout.
- Score a sample for quality. Score five to ten recent pieces from each job against a written rubric, so that later work can be compared with the same standard.
- Start a skipped-work list. Write down the recurring work the team planned and never did. New coverage is counted against it.
- Keep a comparison where you can. If one job, region, or audience segment can stay on the old method for a quarter, or the team can alternate weeks, later outcome comparisons have a control group instead of only a trend.
To rebuild a baseline after a rollout, use the last full quarter before it. Counts, dates, and invoices survive even when nobody logged time. For hours, have the usual person produce two or three pieces the old way and time them. Label a rebuilt baseline as an estimate and say how it was built.
Note any differences between the periods that would move the numbers on their own, such as a product launch, a new hire, a trade show, or a seasonal slowdown. Compare the same season where you can, and say in the report what was unusual.
View the baseline steps at full size (opens in a new tab).
How to adjust AI output for quality
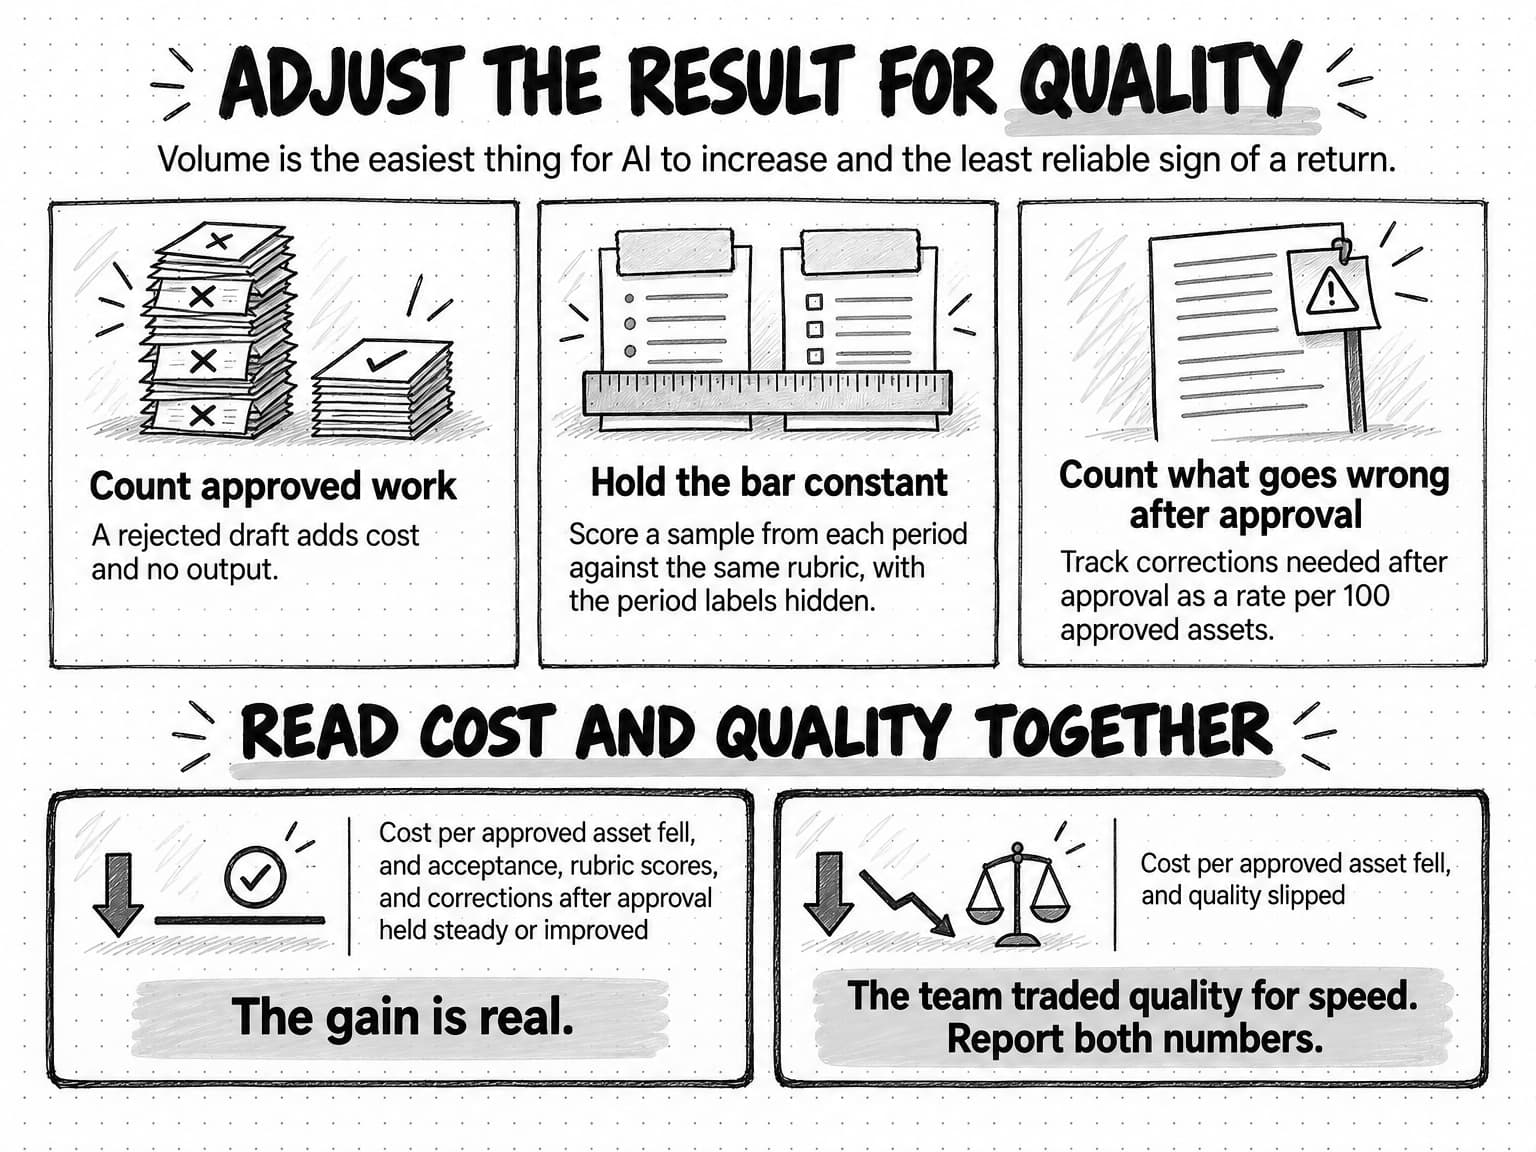
Volume is the easiest thing for AI to increase and the least reliable sign of a return. A team can double its drafts and gain nothing if the extras are rejected, rewritten, or ignored. Three habits stop volume from inflating the result.
First, count approved work. Every metric in this guide divides by approved assets, so a rejected draft adds cost and no output, and a tool that needs ten drafts to produce six approved posts costs more per post than its usage bill suggests.
Second, hold the bar constant. Standards slip when reviewers are busy or drafts look polished, so score a sample from each period against the same written rubric, with the period labels hidden. If scores held, the savings were not bought with weaker work. If they fell, report the drop beside the savings, because a cheaper post that performs worse may cost more than it saved. Building a rubric that two reviewers apply the same way, and a fixed set of test briefs to rerun after changes, is the subject of our guide to AI evals, which covers the quality side of this measurement in depth.
Third, count what goes wrong after approval. A wrong product detail found after publication, a claim that legal asks to withdraw, or a correction to a sent email all cost time, and they belong in the job's cost for the period in which they happen. Track them as a rate.
Corrections after approval per 100 assets = corrections needed after approval ÷ approved assets × 100
Read together, these signals give a quality-adjusted verdict. If cost per approved asset fell while first-pass acceptance, rubric scores, and corrections after approval held steady or improved, the gain is real. If the cost fell and quality slipped, the team traded quality for speed, and the report should show both numbers.
View the quality checks at full size (opens in a new tab).
How to link AI work to business outcomes
Business outcomes make a return hard to dispute, and they are also where AI ROI claims are easiest to overstate. Pipeline depends mostly on what the work says, who sees it, and when, while AI mostly changes how the work is produced, so an outcome measure usually tests the marketing more than the AI. Two narrower questions are more useful. Did the AI-assisted work do at least as well as the work it replaced? Did new coverage produce results that would not have happened otherwise?
Outcome evidence comes in three strengths, and each supports a different claim.
- Use means the work was published, opened, read, forwarded, or used by sales. It shows that the work reached people, which is the minimum for any outcome claim and the basis of the coverage metric.
- Association means results moved alongside the work, as in a before-and-after trend or a content-assisted pipeline figure. The content strategy guide's rule for content-assisted opportunities is a good model, because it states its counting window and treats the result as association without claiming that the content caused the sale.
- Comparison means results for AI-assisted work were measured against a group that didn't get it, over the same period. A holdout, such as sending AI-personalized emails to a random half of a list and the standard email to the other half, or a matched comparison between similar segments, supports an estimate of the effect.
Only comparison evidence belongs inside the ROI figure. Use and association go beside it, with the method, the period, and a plain statement of confidence. A rise in content-assisted pipeline after a rollout is worth reporting, but a sales hire, a price change, or a seasonal upswing could explain it, and a CFO who catches one overclaim is likely to discount the rest of the report.
Two habits strengthen association evidence without a formal experiment. Compare changes rather than levels. If, for example, an AI-assisted channel grew 20% while a similar channel without AI grew 15% over the same months, the five-point difference is the more informative number. And compare the same season. Before expanding a large program, plan a holdout from the start. For the basic measures of whether marketing is working at all, see our beginner's guide to B2B SaaS marketing.
How to calculate AI ROI and payback as a range
With costs, a baseline, and quality-adjusted output in hand, the calculation is short. It uses the standard ROI formula, with the AI cost for the period as the denominator.
AI ROI = (value added − AI cost) ÷ AI cost
AI cost for the period = subscriptions + usage + other AI tools + setup and upkeep hours × loaded hourly cost
This counts setup in the period it happens, so the rollout quarter carries all of it. Spreading setup over a year also works if the report states the rule and keeps it.
The value side needs the most care, because it is where hours saved slips back in. Value comes in three kinds, and each needs its own evidence.
| Cash savings | Spending that stopped or shrank because of the AI work, such as freelance and agency fees, retired tools, or overtime. Evidence: invoices from both periods. Always counted. |
|---|---|
| Capacity put to use | Team hours that the baseline volume of work no longer needs, at the loaded hourly cost, counted only for hours that went into named, approved, used work. Evidence: time logs and the list of that work. |
| Outcome gains | Extra pipeline, conversions, or revenue measured against a comparison group. Evidence: a holdout or a matched comparison. Results that are only associated with the work are reported beside the ROI, not added to it. |
Capacity is the measured version of hours saved. Calculate it for each job, then add the jobs together.
Capacity freed = baseline approved assets × (baseline hours per approved asset − current hours per approved asset)
Working at the baseline volume keeps the comparison fair, because it asks how many hours the work the team already did now needs. A job that got slower subtracts from the total.
Count each hour once. Freed hours have value only if they went somewhere useful, usually into extra work such as more articles or a new weekly summary, so count the hours or the work they produced, never both. This method counts the hours at the loaded rate and uses the list of extra and new work as evidence that they were used. Hours that went nowhere you can name stay out of the value and appear in the report as unaccounted capacity.
Because capacity depends on how the team used its time, report ROI as a range.
Conservative ROI = (cash savings − AI cost) ÷ AI cost
Expected ROI = (cash savings + capacity put to use × loaded hourly cost + outcome gains from comparisons − AI cost) ÷ AI cost
The conservative figure counts only money that stopped leaving the business, and the expected figure adds the capacity the team can show it used and any outcome measured against a comparison. Stating both, with the assumptions behind them, shows how much of the return rests on judgment.
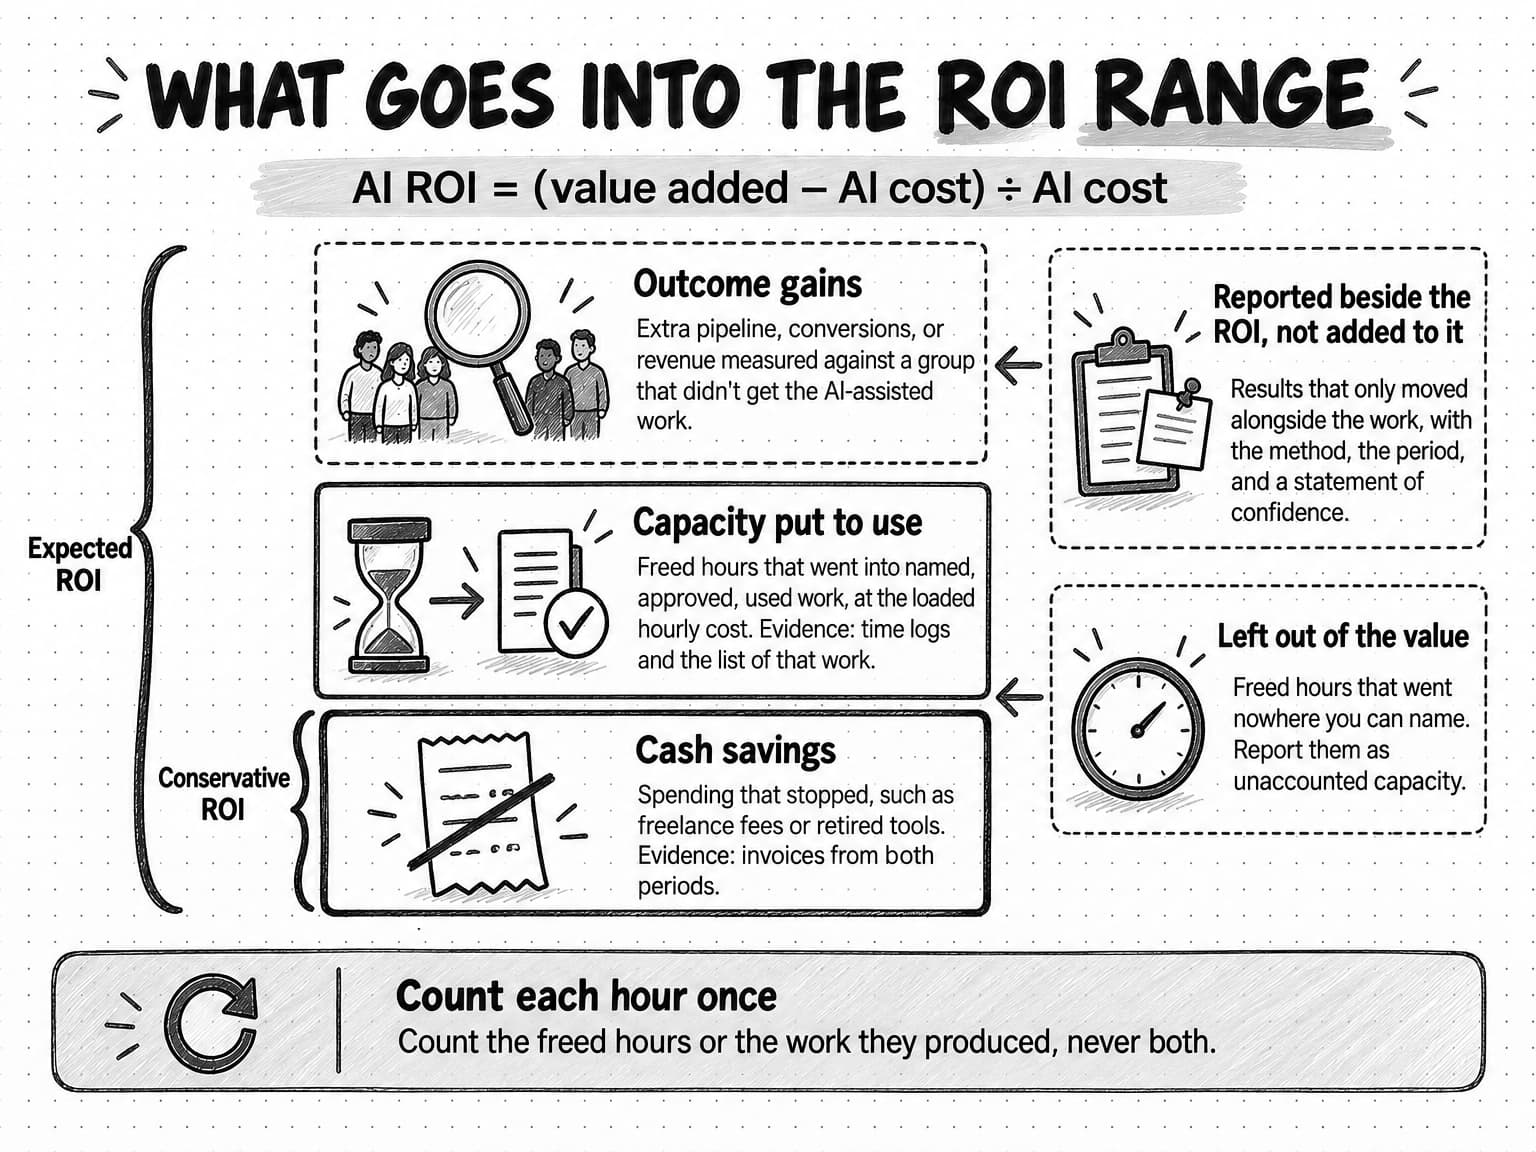
View what goes into the ROI range at full size (opens in a new tab).
Payback answers the question budget owners usually ask next, which is how long the setup takes to recover.
Payback period in months = one-time setup cost ÷ monthly net value
Monthly net value is the value in a typical month minus that month's recurring AI cost, meaning subscriptions, usage, and upkeep. Calculate payback for both ends of the range. If monthly net value is zero or negative, the work does not pay back at its current performance.
No published figure works as a universal target, because a good result depends on what else the money and time could do. Three questions do more than a benchmark. Is the conservative ROI positive? Does the expected payback fall within the period the business budgets for? Is cost per approved asset still improving? A result that passes only in the expected case can still justify continuing if the report names its assumptions.
Timing changes the answer. The first weeks of a rollout carry setup and learning while the savings have barely started, so a measurement taken then looks worse than one taken a quarter later. Economists Erik Brynjolfsson, Daniel Rock, and Chad Syverson describe a similar pattern across whole economies, the productivity J-curve, in which early investment in new processes and skills goes uncounted, so measured productivity growth is understated in a new technology's early years. Their evidence concerns national productivity, not marketing teams, but a team's first month can show the same shape, so measure by quarter.
Worked example: one quarter of AI work at a fictional software company
Sorrelpath sells job-costing software to small construction contractors. Its three-person marketing team worked without AI from January to March and kept the baseline records described above. In April it began using AI to draft blog articles, LinkedIn posts and their images, and the monthly newsletter, and to produce a new weekly competitor summary. At the end of June, the CEO asked what the AI spend had returned.
The first answer was the familiar one. The team estimated that AI saved about ten hours a week, or 130 hours over a 13-week quarter, worth $7,800 at the illustrative loaded cost of $60 an hour, against $1,080 of AI subscriptions and usage. That arithmetic suggests a return of about 620%. The head of marketing then rebuilt the answer from the records. People's hours in the table are running time on each job, including rejected drafts, and leave out setup.
| Illustrative job, Q1 → Q2 | Approved assets | People's hours | Outside and AI spend | Cost per approved asset |
|---|---|---|---|---|
| Blog articles | 6 → 8 | 39 → 42 | $1,500 freelance → $360 AI | $640 → $360 |
| LinkedIn posts with images | 39 → 39 | 39 → 26 | $975 freelance design → $390 AI | $85 → $50 |
| Monthly newsletter | 3 → 3 | 18 → 22.5 | $0 → $90 AI | $360 → $480 |
| Weekly competitor summary | Not done → 10 used of 12 runs | 0 → 6 | $0 → $240 AI | New → $60 per used summary |
In April the team also spent 20 hours on setup, writing the brand and product context, collecting examples of approved work, building briefs, and testing, and later 2 hours on upkeep. Those 22 hours, or $1,320, go into the AI cost for the quarter and stay out of each job's cost per approved asset. The review log and a blind quality sample supplied the rest.
| Illustrative metric, Q1 → Q2 | Blog articles | LinkedIn posts | Newsletter |
|---|---|---|---|
| Time to first usable draft (median) | 6 working days → 1 | 2 working days → same day | 4 working days → 3 |
| Review minutes per approved asset | 120 → 225 | 20 → 30 | 90 → 360 |
| First-pass acceptance rate | 4 of 6 (67%) → 3 of 9 (33%) | 30 of 39 (77%) → 24 of 45 (53%) | 2 of 3 → 0 of 3 |
| Revision rounds | 1.5 → 2.0 | 1.2 → 1.4 | 1.3 → 3.0 |
| Rubric score on a blind sample (0 to 4) | 3.1 → 3.2 | 2.9 → 3.0 | 3.2 → 3.1 |
| Corrections after approval | 0 → 0 | 1 → 1 | 0 → 1 |
The posts were the clearest gain. Each approved post took 40 minutes of people's time instead of 60, and the team stopped paying a freelance designer for routine images, so the cost per post fell from $85 to $50 even though review took longer. Articles cost less mainly because the freelance writer was no longer needed, and the team produced two more, but each draft needed more review and only a third passed at the first review. The newsletter got worse. Its drafts kept missing the company's voice and getting product details wrong, review time quadrupled, and the cost per issue rose from $360 to $480. The competitor summary was new coverage, with 10 of its 12 runs forwarded to sales reps or cited in deal notes, at $60 per used summary. Rubric scores held for articles and posts, so their savings weren't bought with weaker work, while the newsletter kept its score only through three rounds of revision, and one wrong feature name still reached customers.
Measured at the end of April alone, the post workflow would have looked like a failure. People spent more time per approved post than before while the team rewrote the brand context and learned which drafts to discard, and the gain arrived in May and June.
minutes per approved post
View the data
| Period | minutes per approved post |
|---|---|
| Jan | 62 |
| Feb | 60 |
| Mar | 58 |
| Apr | 66 |
| May | 30 |
| Jun | 24 |
Illustration, not a measurement: invented numbers for a fictional company, chosen to show the arithmetic.
Capacity freed is calculated at the baseline volume. Articles needed 6.5 hours of people's time each in the first quarter and 5.25 in the second, which frees 7.5 hours across the six articles the team used to produce. Posts went from an hour to 40 minutes each, freeing 13 hours across 39 posts. The newsletter went from 6 hours to 7.5 an issue, taking 4.5 hours back. Net capacity freed was 16 hours, and the team can name where it went, since the two extra articles took 10.5 hours and the competitor summaries 6, so all 16 count in the expected case.
The estimate of 130 hours counted drafting time that disappeared and missed the longer reviews, the rejected drafts, the slower newsletter, and the 22 hours of setup. In total, the team spent more hours on these jobs in the second quarter than in the first, 118.5 against 96, because setup and new work absorbed what faster drafting saved.
| Illustrative ROI calculation, Q2 | Conservative | Expected |
|---|---|---|
| Cash savings: freelance writing $1,500 and freelance post design $975 | $2,475 | $2,475 |
| Capacity put to use: 16 hours × $60 | Not counted | $960 |
| Outcome gains measured against a comparison | None measured | None measured |
| Value added | $2,475 | $3,435 |
| AI cost: $1,080 AI spend + 22 setup and upkeep hours × $60 | $2,400 | $2,400 |
| ROI for the quarter | 3% | 43% |
| Payback on the $1,200 one-time setup | 2.8 months | 1.6 months |
The one-time cost for payback is the 20 setup hours, or $1,200. Using the quarter's average month, monthly net value is the cash savings minus AI spend and upkeep, which is $425 a month in the conservative case and $745 with the capacity added. Content-assisted opportunities rose from 9 in the first quarter to 12 in the second, but the second quarter included a trade show and there was no comparison group, so the report lists the rise beside the ROI with low confidence and adds nothing for it.
The report to the CEO led with the range, a return of 3% to 43% for the quarter including setup, with the setup cost recovered within the quarter, and then gave one decision per job. Posts would expand to a second weekly format, measured the same way. Articles would continue, with examples of approved articles added to the brief to lift first-pass acceptance. The newsletter needed a fix. Reviewers kept making the same corrections to voice and product details, so the team would move those into the saved brand and product context and test for a quarter, aiming for at least one issue accepted at first review and review time under two hours, or return the newsletter to the old method. The competitor summary would continue while the head of sales confirmed each month that it was still used.
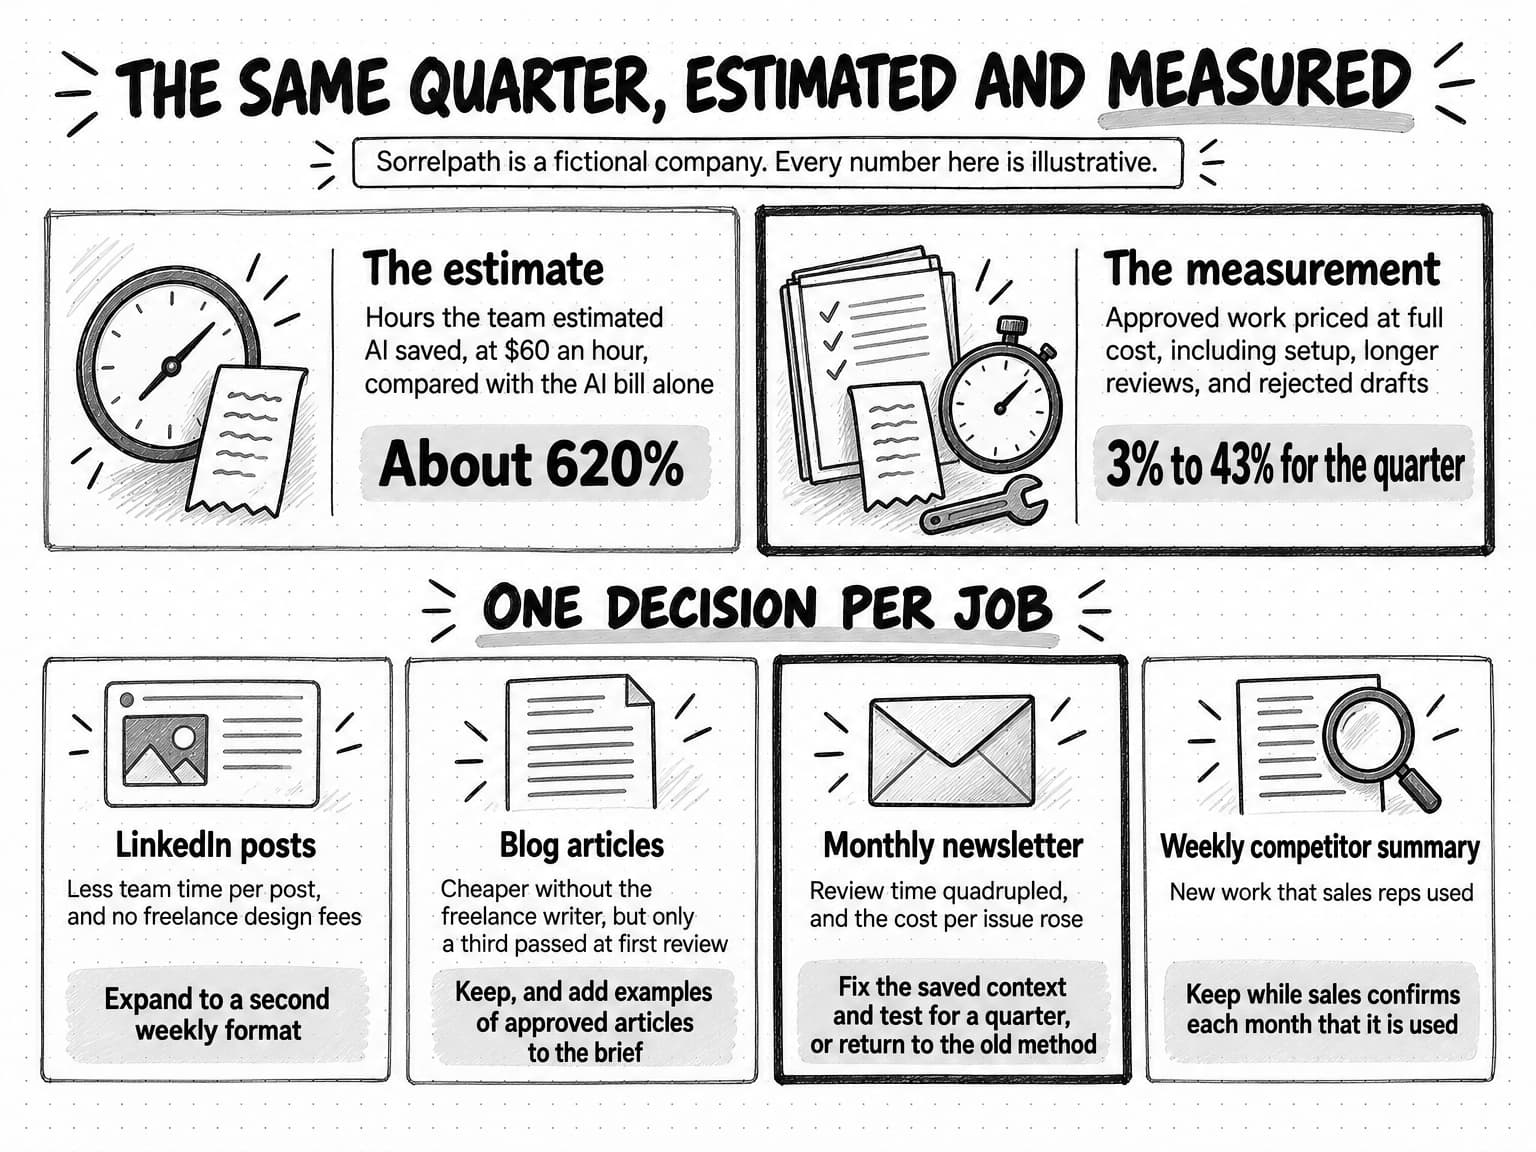
View the worked example at full size (opens in a new tab).
How to report AI ROI to a CEO or board
Budget owners have reason to ask. In July 2024, Gartner predicted that at least 30% of generative AI projects would be abandoned after proof of concept by the end of 2025, citing poor data quality, inadequate risk controls, escalating costs, or unclear business value, and noted that productivity gains can be difficult to translate directly into financial benefit. A measured return, even a modest one, puts a marketing leader in a stronger position than a large estimate.
Lead with the decision and the range. A CEO or board wants to know whether to keep spending, spend more, or stop, so open with the ROI range and payback, then the one or two jobs that explain them. Hours saved can appear as capacity, meaning how many hours the measured work freed and where they went.
Use metrics that hold up in a budget review, which means ones built from records someone else can check.
| Metric | Holds up in a budget review? | Why |
|---|---|---|
| Cost per approved asset against the baseline | Yes | Built from bills, approved counts, and time logs anyone can check |
| Cash savings | Yes | Invoices from both periods show the spending that stopped |
| Coverage that was used | Yes | Each use leaves a record, such as a reply, a deal note, or a citation |
| First-pass acceptance trend | Yes, beside a quality score | Shows whether review is getting lighter for the right reason |
| Self-reported hours saved | No | An estimate, and in the METR trial such estimates pointed the wrong way |
| Drafts or pieces produced | No | Counts output before review, including what was rejected or never used |
| Projected savings | No | A forecast, often made by whoever champions the tool |
Show the job that got worse. A report in which everything improved reads as advocacy, and naming the workflow that went backward, with what the team will do about it, is the strongest evidence that the other numbers were measured rather than chosen.
Compare with the right alternative, which is the old way of doing the same job. For new coverage, the alternative is usually not doing the work, so describe what it was used for instead of pricing it as if someone would otherwise have been paid to do it.
Report to leadership each quarter and track the operating metrics monthly inside the team. Keep the assumptions in one visible place, so you can recalculate if someone challenges the loaded rate. What leadership asks also changes as a team's use of AI matures, from whether one workflow pays to which workflows deserve more investment, and our guide to the AI-native marketing team describes the five stages from first pilot to daily practice.
Template: a one-page AI ROI report
Copy the template and fill it in each quarter. Keep the definitions unchanged between reports so that quarters can be compared, and if a figure is missing, leave the line blank with a note saying why.
AI ROI REPORT
Period: ____________        Baseline period: ____________
Prepared by: ____________   Date: ____________

1. SCOPE
Jobs measured (three to five recurring deliverables):
-
AI tools and services included:
-
Definitions (unchanged between reports):
- Usable draft:
- Approved:
- Minor edit:
- Used:
Loaded hourly cost: $____ an hour (source: ____)
Rule for allocating shared subscriptions to jobs:
Rule for counting setup (in the period it happens, or spread over a year):

2. AI COST FOR THE PERIOD
Subscriptions and usage:                  $______
Other AI tools:                           $______
Setup hours ____ x loaded hourly cost:    $______
Upkeep hours ____ x loaded hourly cost:   $______
Total AI cost:                            $______

3. OUTPUT AND EFFICIENCY (baseline -> this period, one block per job)
Job: ____________
Approved assets:                  ____ -> ____
People's hours (running time):    ____ -> ____
Outside spend:                    $____ -> $____
AI spend:                         $____ -> $____
Cost per approved asset:          $____ -> $____
Time to first usable draft:       ____ -> ____
Review minutes per asset:         ____ -> ____
First-pass acceptance rate:       ____ -> ____
Revision rounds:                  ____ -> ____

4. QUALITY
Rubric score on a blind sample:               ____ -> ____
Corrections after approval per 100 assets:    ____ -> ____

5. COVERAGE
Recurring runs planned / delivered / used:    ____ / ____ / ____
New work that was skipped before, and how it was used:
-

6. VALUE
Cash savings (spending that stopped):         $______
Capacity freed at baseline volume (hours):    ______
  Hours that went into named work:            ______
  Unaccounted hours:                          ______
Outcome gains against a comparison:           $______ (method: ____)

7. ROI AND PAYBACK
Conservative ROI = (cash savings - AI cost) / AI cost:          ____%
Expected ROI = (cash savings + capacity used x loaded hourly
  cost + outcome gains - AI cost) / AI cost:                    ____%
One-time setup cost:                                            $______
Monthly net value (conservative / expected):                    $____ / $____
Payback in months (conservative / expected):                    ____ / ____

8. RESULTS REPORTED BESIDE THE ROI (not added to it)
Result, method, period, and confidence (low / medium / high):
-

9. LIMITS
Changes between periods that could affect these numbers
(launches, hires, events, season, a rebuilt baseline):
-

10. DECISIONS (one per job)
Job: ____________   Keep / Expand / Fix / Stop
Reason, next check, and date:
-
The decisions section is the one leadership will read most closely. Keep means the job pays and should continue. Expand means it pays and has room to grow, measured the same way. Fix means the job has a specific problem, such as heavy revision, with a test and a date for checking it. Stop means the job costs more than the old way after a fix has been tried, and returning to the old method is a result worth reporting too.
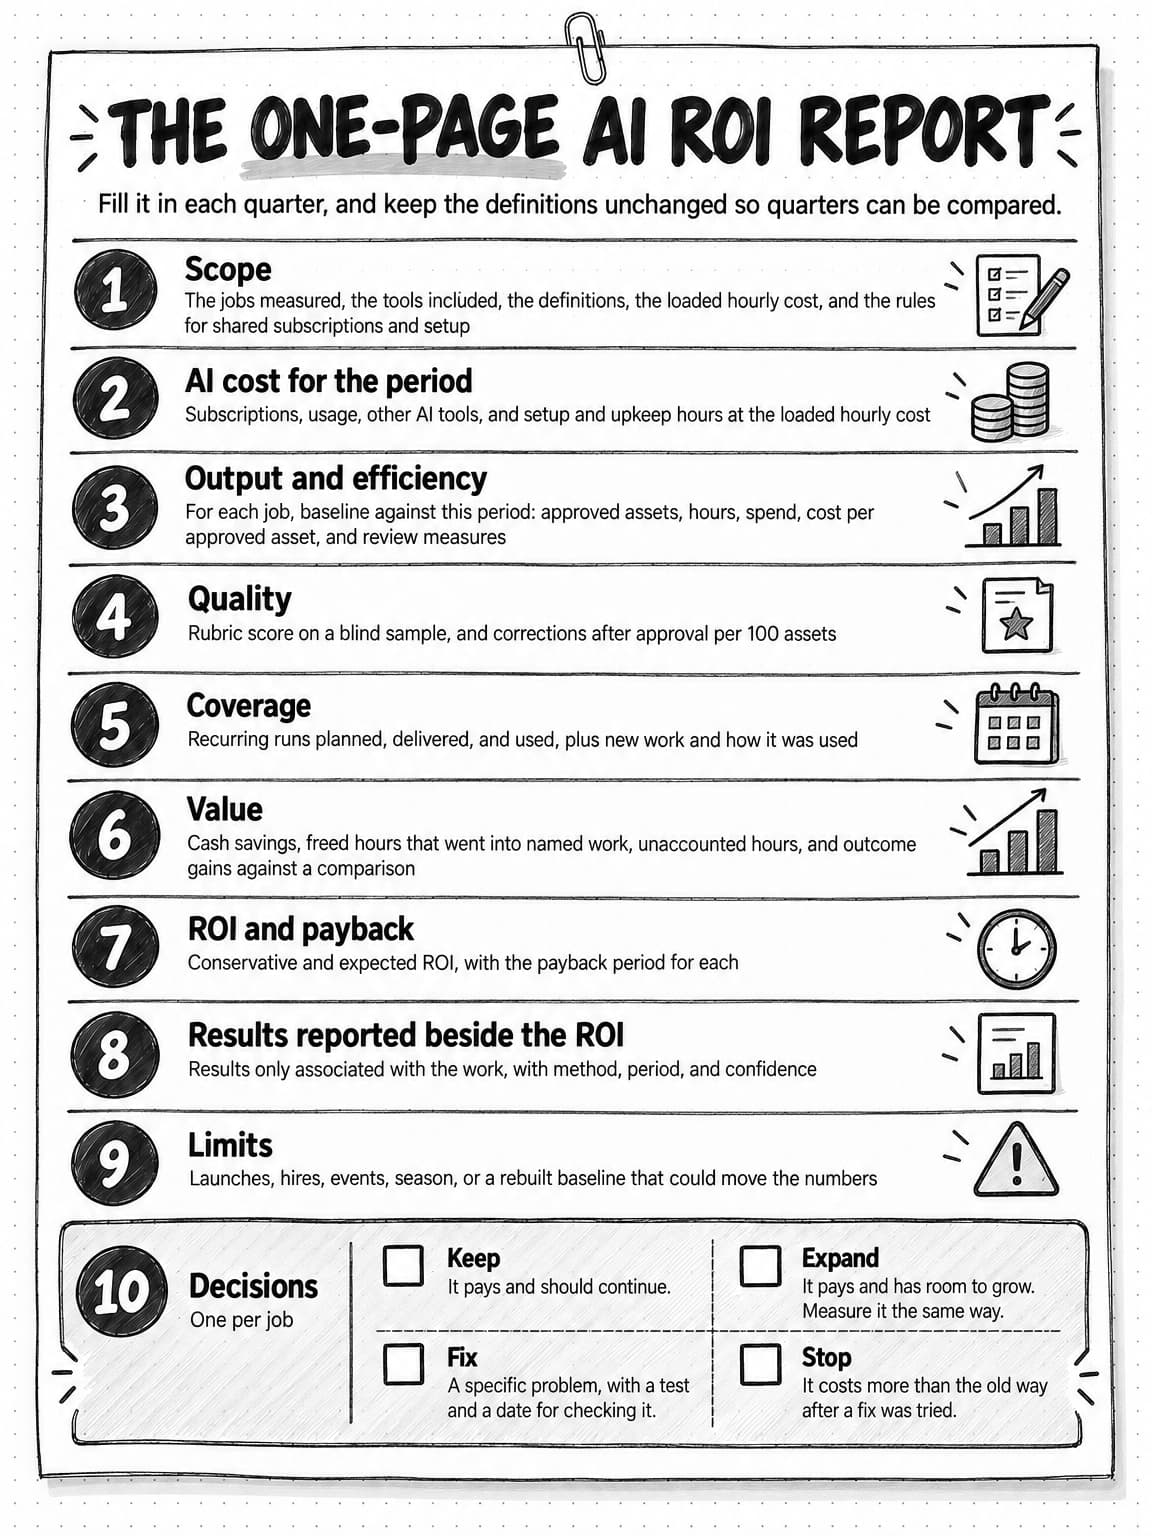
View the one-page AI ROI report at full size (opens in a new tab).
Common mistakes when measuring AI ROI
Most weak AI ROI figures come from a few shortcuts taken under deadline.
- Multiplying estimated hours by an hourly rate. Every input is weak, and dividing by the subscription leaves out setup and review. Use capacity freed from time logs, and price the work with cost per approved asset.
- Counting drafts instead of approved work. A count of pieces generated includes everything rejected, rewritten, or never published. Divide by approved assets, and count rejected drafts as cost.
- Leaving review, rework, and setup out of the cost. The calculation then compares the AI's best case with the old way's full cost.
- Counting freed hours and the work they paid for. If the hours saved on posts went into two extra articles, count the hours or the articles, never both.
- Measuring too early. The first month carries setup and learning but little of the saving, so measure by quarter.
- Changing definitions between periods. If "approved" drifts to mean "good enough for now", the metrics improve without any real change. Freeze the definitions before the baseline and print them in every report.
- Adding outcomes without a comparison. Pipeline that rose after a rollout may have risen for other reasons, so add outcome gains to the ROI only from a holdout or a matched comparison.
- Averaging across jobs. A blended figure hides the job that got worse, as the newsletter did in the worked example. Report each job first, then the total.
How to measure the return on Ampere work
Ampere, the AI marketing agent, keeps several of the records this method needs. Your team still keeps the review log and the record of what was used.
For cost, completed Ampere sessions can show settled credit receipts with exact calculations across supported work, including the agent's usage and attributed tool usage such as AI Tool runs, and completed turns can show a turn-credit summary. AI Tool run detail and history show the exact credits a run used once its consumption is recorded. While a receipt is still being finalized, or where usage can't be attributed, treat that cost as unknown rather than zero. To convert credits into dollars, use 200 credits per dollar for monthly plans and top-ups; annual plans give 9.09% more credits per dollar, about 218. Credits are shared across the Organization, so allocate them by job.
For coverage, the Scheduled Tasks Overview shows runs and success rate for a time range you choose, along with the number of tasks and any failing tasks, and run history can be filtered by outcome, such as succeeded, partial, failed, or never ran. A succeeded run isn't coverage until someone uses the result. Each scheduled task result lands back in the Project ready to review, a natural place to note whether it was used.
Reusable context affects the briefing part of cost per approved asset. Brand memory holds saved, reviewable knowledge about your brand and market that Ampere can use in later work, and a Project keeps briefs, files, and related sessions together so that new work starts with context. Measure briefing minutes per asset before and after you save the context to see what changed. The model selector describes each option's task fit and relative cost, so you can compare cost per approved asset between models on the same job. Ampere's output can be inaccurate or incomplete, and people review it before anything goes out, so review time belongs in the cost of every approved asset.
Sources and further reading
- Marketing AI Institute and SmarterX, 2025 State of Marketing AI Report (PDF), 2025. A survey of 1,882 respondents, fielded February to April 2025 through the institute's own channels.
- Joel Becker, Nate Rush, Elizabeth Barnes, and David Rein, Measuring the Impact of Early-2025 AI on Experienced Open-Source Developer Productivity, METR, July 2025. A randomized trial with 16 developers and 246 tasks.
- Joel Becker, Nate Rush, Tom Cunningham, David Rein, and Khalid Mahamud, We are Changing our Developer Productivity Experiment Design, METR, February 24, 2026. Includes the caution about self-reported speedups.
- Anders Humlum and Emilie Vestergaard, Still Waters, Rapid Currents: Early Labor Market Transformation under Generative AI, NBER Working Paper 33777, May 2025, revised March 2026. Earlier versions were titled Large Language Models, Small Labor Market Effects.
- Alexander Bick, Adam Blandin, and David Deming, The Impact of Generative AI on Work Productivity, Federal Reserve Bank of St. Louis, February 27, 2025.
- Aditya Challapally and colleagues, The GenAI Divide: State of AI in Business 2025 (PDF), MIT NANDA, July 2025. Labeled preliminary findings; linked as the Internet Archive’s August 18, 2025 capture of the PDF that MIT hosted at publication.
- Jessica Apotheker and colleagues, The Widening AI Value Gap: Build for the Future 2025 (PDF), Boston Consulting Group, September 2025.
- Jessica Apotheker and colleagues, The Formula for Agentic AI Value, The Applied AI Index 2026, Boston Consulting Group, September 30, 2026.
- Dan Tinkoff, Lieven Van der Veken, and Michael Chui, with Tara Balakrishnan, The state of AI in 2026: On the road to ROI (PDF), McKinsey, August 2026.
- IBM Institute for Business Value, IBM Study: CEOs Double Down on AI While Navigating Enterprise Hurdles, May 6, 2025. The 2025 CEO Study, conducted with Oxford Economics.
- Deloitte, Now decides next: Generating a new future (PDF), State of Generative AI in the Enterprise, quarter four report, January 2025.
- Deloitte, AI ROI: The paradox of rising investment and elusive returns, October 22, 2025.
- Wharton Human-AI Research and GBK Collective, Accountable Acceleration: Gen AI Fast-Tracks Into the Enterprise (PDF), October 2025.
- Gartner, Gartner Predicts 30% of Generative AI Projects Will Be Abandoned After Proof of Concept By End of 2025, press release, July 29, 2024.
- Erik Brynjolfsson, Daniel Rock, and Chad Syverson, The Productivity J-Curve: How Intangibles Complement General Purpose Technologies, American Economic Journal: Macroeconomics, January 2021.
- US Bureau of Labor Statistics, Employer Costs for Employee Compensation, June 2026, released September 9, 2026.
Frequently Asked Questions
What does AI ROI mean?
AI ROI, the return on investment of AI, is the value that AI-assisted work adds, minus everything that work costs, divided by that cost, compared with how the same work was done before. For a marketing team, the cost includes setup, review, and correction time as well as subscriptions and usage, and the value means spending that stopped, freed time put to named use, and results measured against a comparison.
How do you calculate AI ROI?
Calculate AI ROI by subtracting the AI cost for the period from the value added and dividing by the AI cost. The AI cost is subscriptions, usage, other AI tools, and setup and upkeep hours at a loaded hourly cost. A conservative figure counts only cash savings, such as freelance fees that stopped, while an expected figure adds freed hours that went into named work and outcome gains measured against a comparison.
What metrics show the ROI of AI in marketing?
The metrics that show the ROI of AI in marketing are cost per approved asset, time to first usable draft, review minutes per approved asset, first-pass acceptance rate, revision rounds, coverage of recurring work that was used, and links to outcomes measured against a comparison. Calculate each one per job against a baseline of the old way. Cost per approved asset matters most, because it prices finished work at its full cost.
What is a good ROI for AI in marketing?
A good ROI for AI in marketing has no universal benchmark, because published surveys define a return, choose respondents, and set time windows too differently to compare. A practical test asks whether the conservative ROI, which counts only cash savings, is positive, whether expected payback falls within the period the business budgets for, and whether cost per approved asset is still improving. Expect the first month to look worse than later ones.
Do most AI projects fail to deliver a return?
Whether most AI projects fail to deliver a return depends on how a study defines a return. MIT NANDA's preliminary research, published in July 2025, found 95% of organizations getting zero return from generative AI six months after a pilot, while in McKinsey's 2026 survey, 37% of respondents reported some contribution from AI to operating profit. Yet in a Deloitte survey published in January 2025, 74% of leaders said their most advanced generative AI initiative met or exceeded ROI expectations.
How do you measure productivity gains from AI?
Measure productivity gains from AI as people's hours per approved asset, compared with a baseline of the same job done without AI, using time logs rather than estimates. Self-reports can mislead. In METR's 2025 randomized trial, experienced developers believed AI had made them about 20% faster when tasks with AI allowed took 19% longer. Then check where the freed hours went, because saved time has value only when it is put to use.
How do you measure the ROI of AI agents?
Measure the ROI of AI agents as you would other AI work, by pricing each approved deliverable at its full cost, including the agent's usage and the people time spent briefing, reviewing, and fixing its work, and comparing that cost with a baseline. Agents take many steps per job, so read their usage from records. For recurring agent work, count the runs whose output someone used.
How do you measure the ROI of AI marketing automation?
Measure the ROI of AI marketing automation by counting the recurring runs whose output someone used and pricing each used result at its full cost. Coverage, the share of planned runs that delivered used output, shows whether the automation works in practice, and a list of new work shows what it added. Hours freed from existing work count only when they went into named work, and output nobody uses is only a cost.
What should an AI ROI report include?
An AI ROI report should include the period and baseline, the jobs measured and their definitions, the full AI cost including setup, cost per approved asset against the baseline, quality and coverage results, and value split into cash savings and capacity put to use. It should give ROI and payback as a range, list results that are only associated with the work separately, state its limits, and end with a decision for each job.