How to measure content marketing ROI, including what attribution can't see
A method for founders and B2B marketing leads who have to justify content spend while buyers read without clicking: count the full cost, grade the return by strength of evidence, find what attribution misses, test incrementality on a small budget, and report ROI as a range.
41 min readWritten by Ampere
Short answer
How do you measure content marketing ROI?
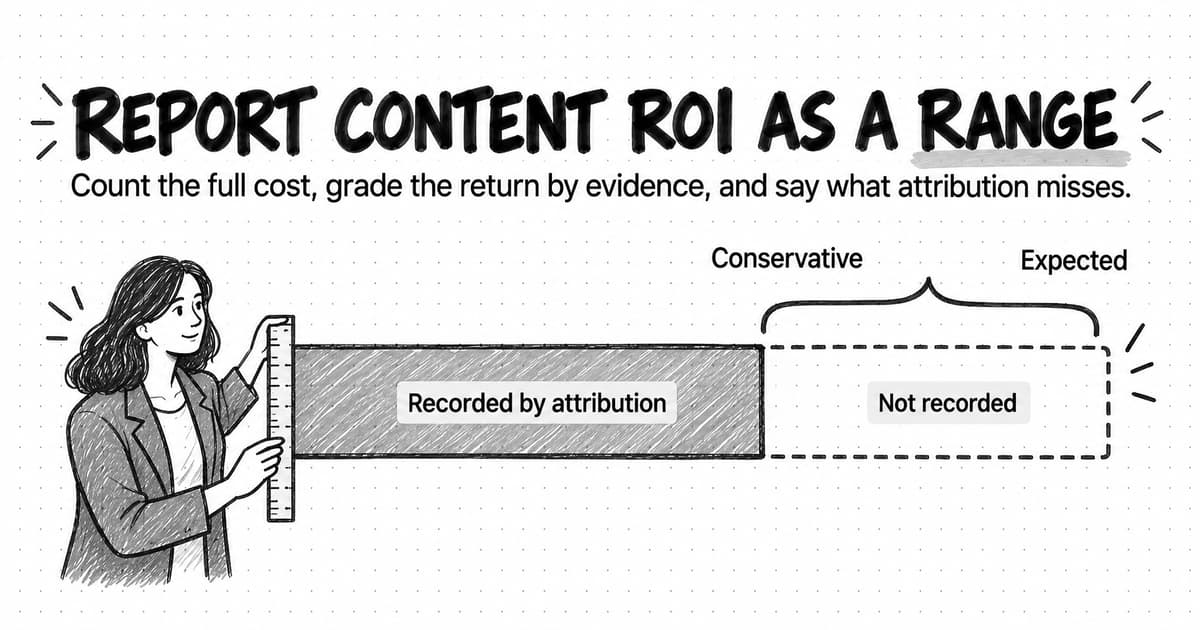
Measure content marketing ROI by subtracting the full cost of content, including people's time, freelancers, tools, and distribution, from the gross profit content helped produce, then dividing by that cost. In B2B, grade the return by evidence: count attributed pipeline in full, credit an agreed share of influenced pipeline, and report what attribution misses, such as AI answers and private sharing, beside the number.
Summary
A single attributed number gets content marketing ROI wrong in a predictable direction. Long buying cycles, buying groups of many people, and reading that happens in AI answers, feeds, and private chats all leave few clicks, so attribution tools usually undercount what content did. The fix is to measure the recorded part precisely, estimate the rest openly, and keep the two apart.
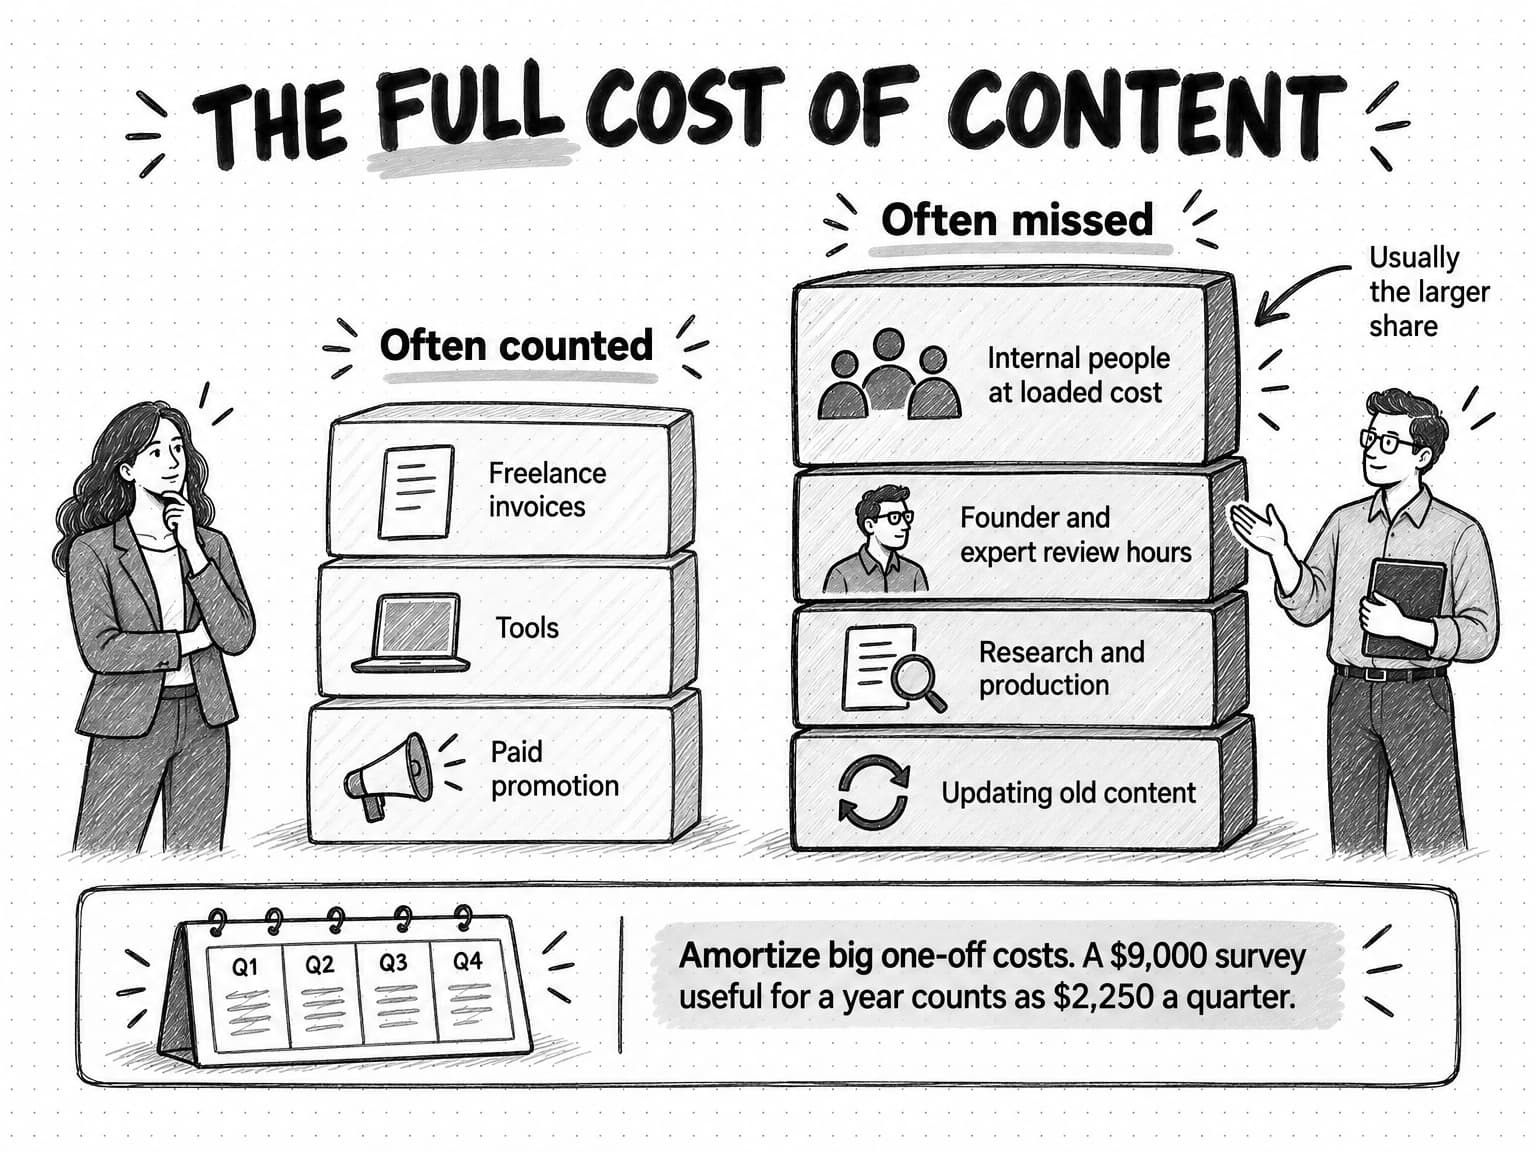
The cost of content marketing is usually undercounted because people's time is left out. A defensible cost includes loaded salaries, subject-matter expert hours, freelancers, production, tools, distribution, and maintenance, with large one-off costs such as a research survey amortized across the quarters the asset stays useful.
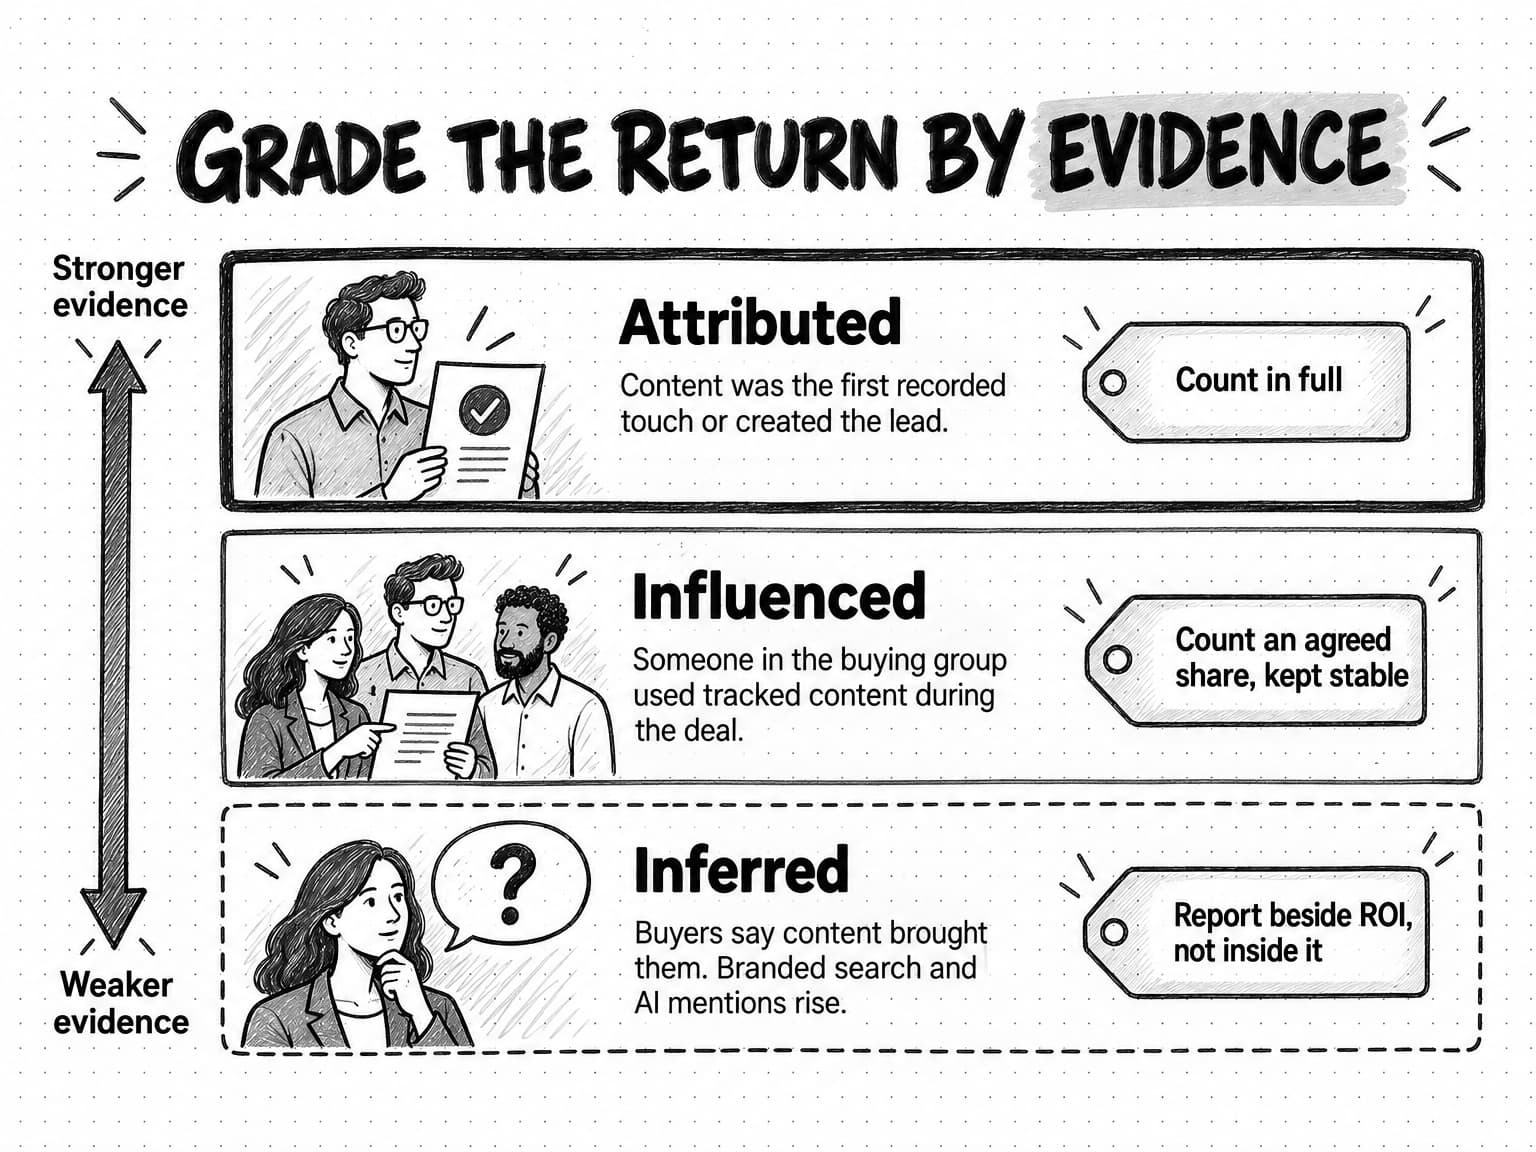
The return on content is easiest to defend when it is graded by strength of evidence. Attributed pipeline counts in full, an agreed and stable share of influenced pipeline is credited, and inferred signals such as self-reported mentions, branded search, and AI answer visibility are reported beside the ROI figure. Pipeline becomes value through the company's own win rate and gross margin.
Every attribution model, data-driven ones included, sees only recorded touches, so models are best for comparing assets with a consistent rule. Cohort analysis by publication quarter handles the time lag, and simple holdout tests, such as withholding a newsletter series from a random share of subscribers, can replace an assumed influence share with evidence.
A fully worked fictional example shows one quarter of content costing $53,350 returning between minus 28% in the first year on attributed deals alone and about 237% over a customer lifetime with credited influence. The guide includes a copyable quarterly report template that states the range, the assumptions, what the number leaves out, and the decisions it leads to.
Contents
- What content marketing ROI means
- Why content marketing ROI is hard to measure in B2B
- What belongs in the cost of content marketing
- What counts as the return on content
- Attribution models and their blind spots
- Self-reported attribution: asking buyers what they remember
- Dark social, zero-click searches, and AI answers
- Leading and lagging indicators of content ROI
- How to measure ROI by content type
- Time lag and cohort analysis
- Incrementality tests a small team can run
- Worked example: one quarter of content ROI at a fictional software company
- A quarterly content ROI report template
- Common content ROI mistakes
- How Ampere helps with content ROI work
- Sources and further reading
- Frequently Asked Questions
The question usually arrives at budget time. The CEO, a board member, or a finance lead looks at the content line, which might be one writer's salary, a freelance budget, a design contractor, a few tools, and some paid promotion, and asks what it returned. The marketing lead opens the analytics report and finds a handful of demo requests that came through a blog post, a lot of traffic that converted into nothing visible, and a nagging sense that the report is missing most of what content did that quarter.
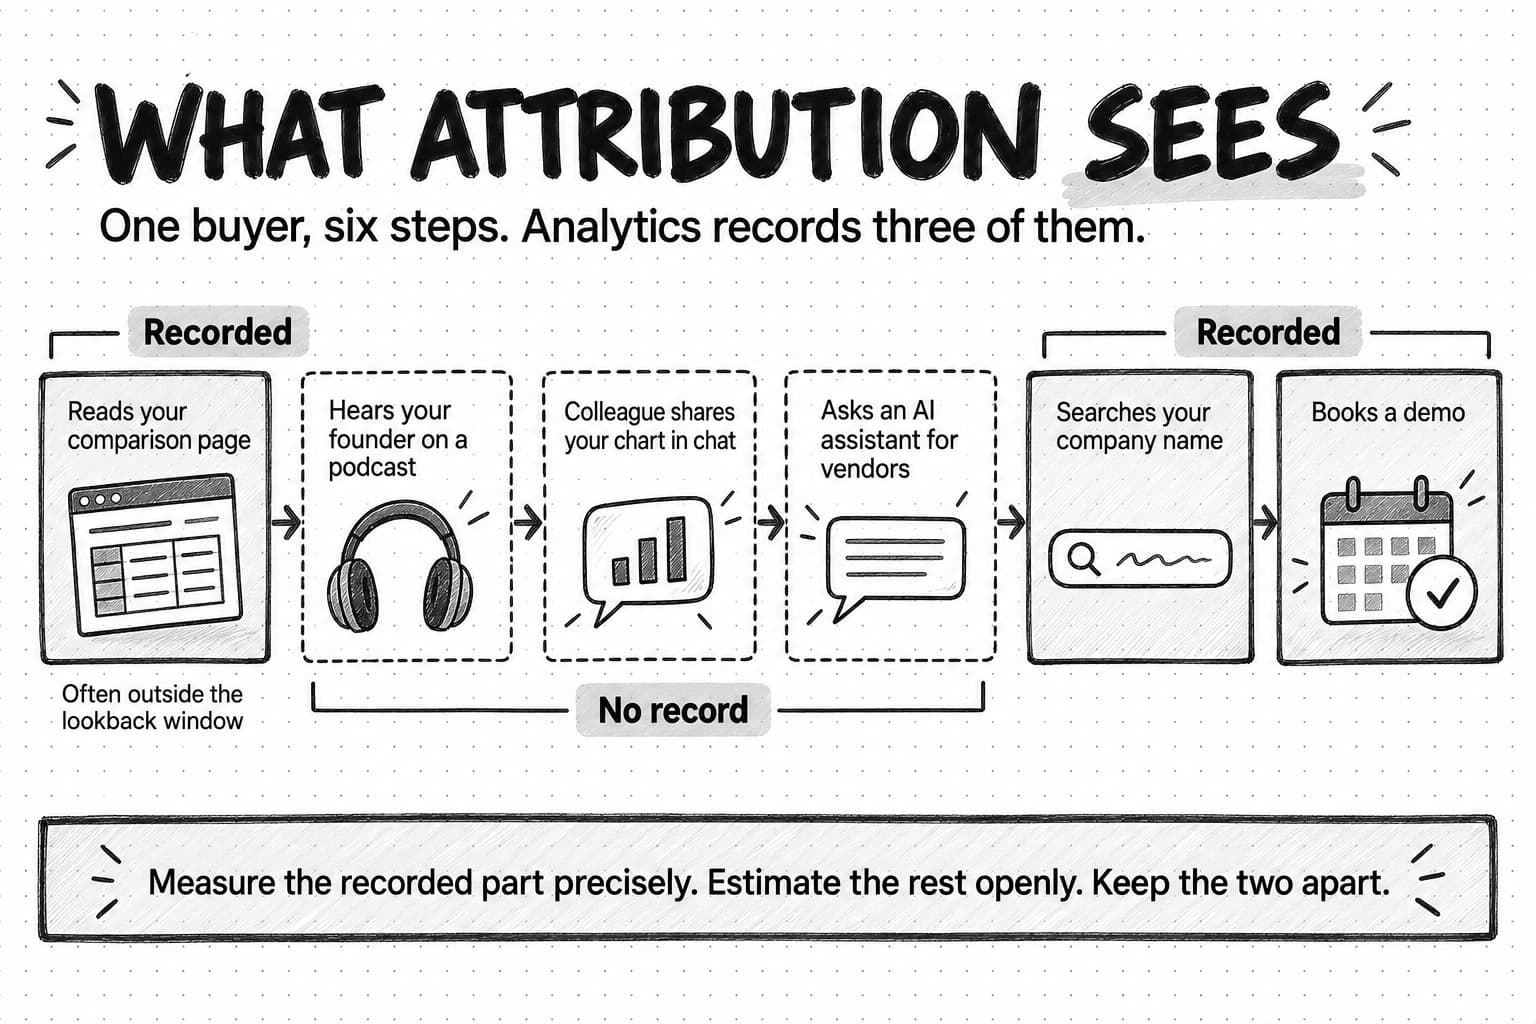
That sense is usually right. A buyer reads a comparison page in March, hears the founder on a podcast in April, sees a chart from the company's benchmark report pasted into a colleague's chat in May, asks an AI assistant which vendors to consider in June, and then types the company's name into Google and books a demo. The analytics tool records a branded search. The CRM records an inbound demo request. Nothing in either system says that four pieces of content did most of the persuading. Meanwhile, the AI assistant may have summarized one of the company's articles without sending a single visit.
Content marketing ROI is the return a company gets from its content, measured as the value content produces for the business, minus the full cost of making and distributing it, divided by that cost. The formula is simple. The work is in the two inputs. The cost side is routinely undercounted, because people's time is left out. The value side is routinely undercounted in a different way, because attribution tools see clicks and form fills, and much of what B2B content does happens without either.
This guide is for founders and B2B marketing leads who have to justify content spend to people who control the budget. It covers what belongs in the cost, how to grade the return by strength of evidence, what attribution models miss, how to account for self-reported answers, dark social, and AI answers, how to measure each content type, how to handle the time lag, and which incrementality tests a small team can run. It finishes with a fully worked fictional example and a quarterly report template you can copy. If your question is the return on AI tools rather than on content, our guide to measuring the ROI of AI in marketing covers that separately.
What content marketing ROI means
Marketing ROI, in its general form, is the profit a marketing activity produces relative to what it cost. Content marketing ROI applies the same idea to content: articles, comparison pages, case studies, research reports, newsletters, LinkedIn posts, videos, webinars, and the other material a company publishes to help buyers understand a problem and choose a solution.
The standard formula is:
Content marketing ROI = (Value attributed to content − Content cost) ÷ Content cost × 100A result of 100% means content returned twice what it cost: the cost back, plus the same again. A result of 0% means it broke even. A negative result means it cost more than it returned in the period measured.
Three choices inside that formula change the answer more than any spreadsheet skill, so decide them before you calculate anything.
Revenue or gross profit. If content helped win $100,000 of new annual revenue, the business did not gain $100,000. It gained the margin on that revenue after the cost of delivering the product. A software company with 80% gross margin gained $80,000. Using revenue instead of gross profit inflates ROI, and a finance lead will notice. Use gross profit whenever you can get the margin figure.
First-year value or lifetime value. A subscription customer pays for several years. Counting only the first year makes content look worse than it is; counting an optimistic lifetime makes it look better. A defensible middle is to report both: first-year gross profit, which is close to cash, and an expected lifetime figure based on your actual average customer lifetime or retention data, clearly labeled as an estimate.
Which value counts. Value can mean revenue from deals where content was the first or last recorded touch, a share of revenue from deals where content was involved somewhere, or estimates of influence that no system recorded. Each is a different claim with a different strength of evidence. The rest of this guide argues that you should report them separately, as a range, rather than adding them together into one number.
Two related terms are worth separating. Return on ad spend (ROAS) divides revenue by advertising spend only; it ignores the people and production costs that make up most of a content budget, so it is the wrong measure for content. Payback period is how many months of gross profit it takes to recover the cost. Boards often find payback easier to judge than a percentage, because it answers "when do we get the money back?"
Why content marketing ROI is hard to measure in B2B
The difficulty comes from how business buying works, not from weak analytics skills. Four features of B2B buying break the simple formula.
The sales cycle is long. In the 6sense 2025 Buyer Experience Report, a survey of nearly 4,000 B2B buyers across North America, EMEA, and APAC, the average buying cycle was 10.1 months, down from 11.3 months in 2024. Content published this quarter may not show up in closed revenue for a year. A quarterly ROI calculation that only counts revenue closed in the same quarter is measuring last year's content, if it measures anything.
Many people decide. Forrester's State of Business Buying 2024, published in December 2024, reports that on average 13 people within an organization are involved in a buying decision, and that 89% of purchases involve two or more departments. The person who read your research report is often not the person who fills in the demo form, so tools that track one person's path miss the hand-off between colleagues.
Buyers decide before they talk to you. The same 6sense report found buyers made first contact with a vendor on average 61% of the way through the buying journey and chose a vendor from their day-one shortlist 95% of the time. It also found that 94% of buyers use large language models during the purchase. These are self-reported survey figures, but they mean most of the evaluation that content influences happens before anyone becomes a lead your CRM can see.
Much reading produces no click. Pew Research Center tracked the browsing of 900 U.S. adults in March 2025: users clicked a traditional search result on 8% of visits to Google results pages with an AI summary, against 15% when no summary appeared, and clicked a link inside the summary on 1% of visits. An AI answer that paraphrases your article can teach a buyer about your product without a visit you can measure, and so can a LinkedIn post read in the feed, a newsletter read in the inbox, or a link shared in private chat.
Marketers report the result. In the Content Marketing Institute and MarketingProfs B2B Content and Marketing Trends: Insights for 2026 report, published October 8, 2025 from a survey of 1,015 B2B marketers fielded in mid-2025, measuring content effectiveness was the third most common content challenge, cited by 33%, behind creating content that prompts a desired action (40%) and resource constraints (39%).
None of this means content ROI cannot be measured. It means a single attributed number will be wrong in a predictable direction, usually too low, and the job is to measure what can be measured precisely, estimate what cannot, and keep the two apart.
What belongs in the cost of content marketing
ROI errors usually start on the cost side, and they usually make content look cheaper than it is. A team that counts the freelance invoices and the SEO tool subscription but leaves out the content lead's salary will calculate an impressive ROI that collapses the first time finance checks it. A result built on the full cost is the one that holds up when finance checks it.
| Cost line | What to include | How to calculate it |
|---|---|---|
| Internal people | Writers, editors, content strategists, designers, video producers, and the share of a marketing lead's time spent on content | Loaded annual cost (salary plus benefits, payroll taxes, and equipment) × share of time on content ÷ 4 for a quarter |
| Subject-matter experts | Time from founders, product managers, engineers, customer success, and sales spent in interviews, reviews, and approvals | Hours × a loaded hourly rate. This is often the most undercounted line. |
| Freelancers and agencies | Writers, editors, designers, video editors, translators, and research help | Invoices for the period |
| Production | Stock media, illustration, audio, video shoots, transcription, survey panels, and data purchases | Invoices, with large one-off costs amortized (see below) |
| Tools | Content management, SEO research, design, analytics, newsletter platform, AI tools, and project management | Subscription cost × share used for content |
| Distribution | Paid promotion of content, newsletter sponsorships, syndication fees, and event or webinar platforms | Spend for the period |
| Maintenance | Time spent updating, refreshing, merging, and fact-checking existing content | Hours × loaded rate, or a share of the content team's time |
Loaded cost, not salary. A person's salary understates what they cost the company, because benefits, employer taxes, equipment, and software add to it. Your finance team will have a loaded-cost multiplier or can calculate one; use theirs rather than guessing, because using their number makes your report easier for them to accept.
Amortization for durable assets. Some content is used for years. An original research report that cost $9,000 in survey panel fees and a month of a writer's time will be cited, repurposed, and shared for a year or more, and a well-maintained comparison page can bring buyers for several years. Charging the full cost to the quarter it was published makes that quarter look terrible and every later quarter look free. Amortizing means spreading a large one-off cost evenly across the period you expect the asset to be useful: a $9,000 survey expected to be useful for a year becomes $2,250 a quarter. Choose a simple rule, such as amortizing any single content cost over $5,000 across four quarters, write it down, and apply it consistently. A rule you can explain is worth more than a precise one you cannot.
Leave out costs that would exist without the content program. The product marketing manager's time on launch messaging belongs to the launch, not to content, even if some of it later became a blog post.
What counts as the return on content
The value side is where most of the judgment sits. Content creates value through several routes, and they differ in how directly you can observe them.
Direct conversions. A reader lands on an article, downloads a template, and becomes a lead that turns into an opportunity. Or a reader on a comparison page clicks through to a trial. These are the routes attribution tools see best.
Sourced pipeline. Opportunities where content was the first recorded touch, or where a content conversion created the lead. Many teams call this content-sourced pipeline.
Influenced pipeline. Opportunities where someone in the buying group engaged with tracked content before or during the deal, even though another channel created the lead. In B2B this is often larger than sourced pipeline, because much content does its work in the middle of a decision.
Sales assist. Content sales reps send to prospects: case studies, security documentation, ROI guides, comparison pages, and recorded demos. A case study that answers the objection blocking a deal produces real value, but the deal will be credited to the rep and to whatever channel created the lead. Our guide to writing a B2B case study sales will send covers how to build these assets so they get used.
Customer value. Onboarding guides, help content, and product education that improve activation, reduce support load, or support expansion. These are real returns, but they belong in the ROI only if you can measure them, for example through support tickets deflected or activation rates among readers.
Cost avoidance. Organic search traffic that would otherwise have to be bought through paid search. Some teams estimate this by multiplying organic clicks on commercial pages by what those clicks would cost as ads. It is a useful comparison for a board, but it measures what you would have spent, not what you earned, so report it beside ROI rather than inside it.
The practical step is to grade each piece of value by the strength of its evidence. A three-tier model works for most teams:
| Tier | What it includes | Evidence | How to use it in ROI |
|---|---|---|---|
| Attributed | Conversions and opportunities where content was the first or last recorded touch, or created the lead | Recorded by analytics or CRM | Count in full. This is the conservative floor. |
| Influenced | Opportunities where a buying group member engaged with tracked content within a defined window, plus deals where reps recorded sharing content | Recorded, but the causal role is uncertain | Count a stated share, such as 25% or 30%, chosen in advance and kept stable |
| Inferred | Self-reported mentions, dark social, branded search growth, AI answer visibility, sales feedback | Indirect or qualitative | Report beside ROI as corroboration, not inside the number |
The share you apply to influenced pipeline is a judgment, and it should look like one. Pick a figure with your finance lead, write down why, and keep it constant from quarter to quarter so changes in ROI reflect changes in performance rather than changes in assumptions. If you later run an incrementality test, use its result to replace the judgment.
Attribution models and their blind spots
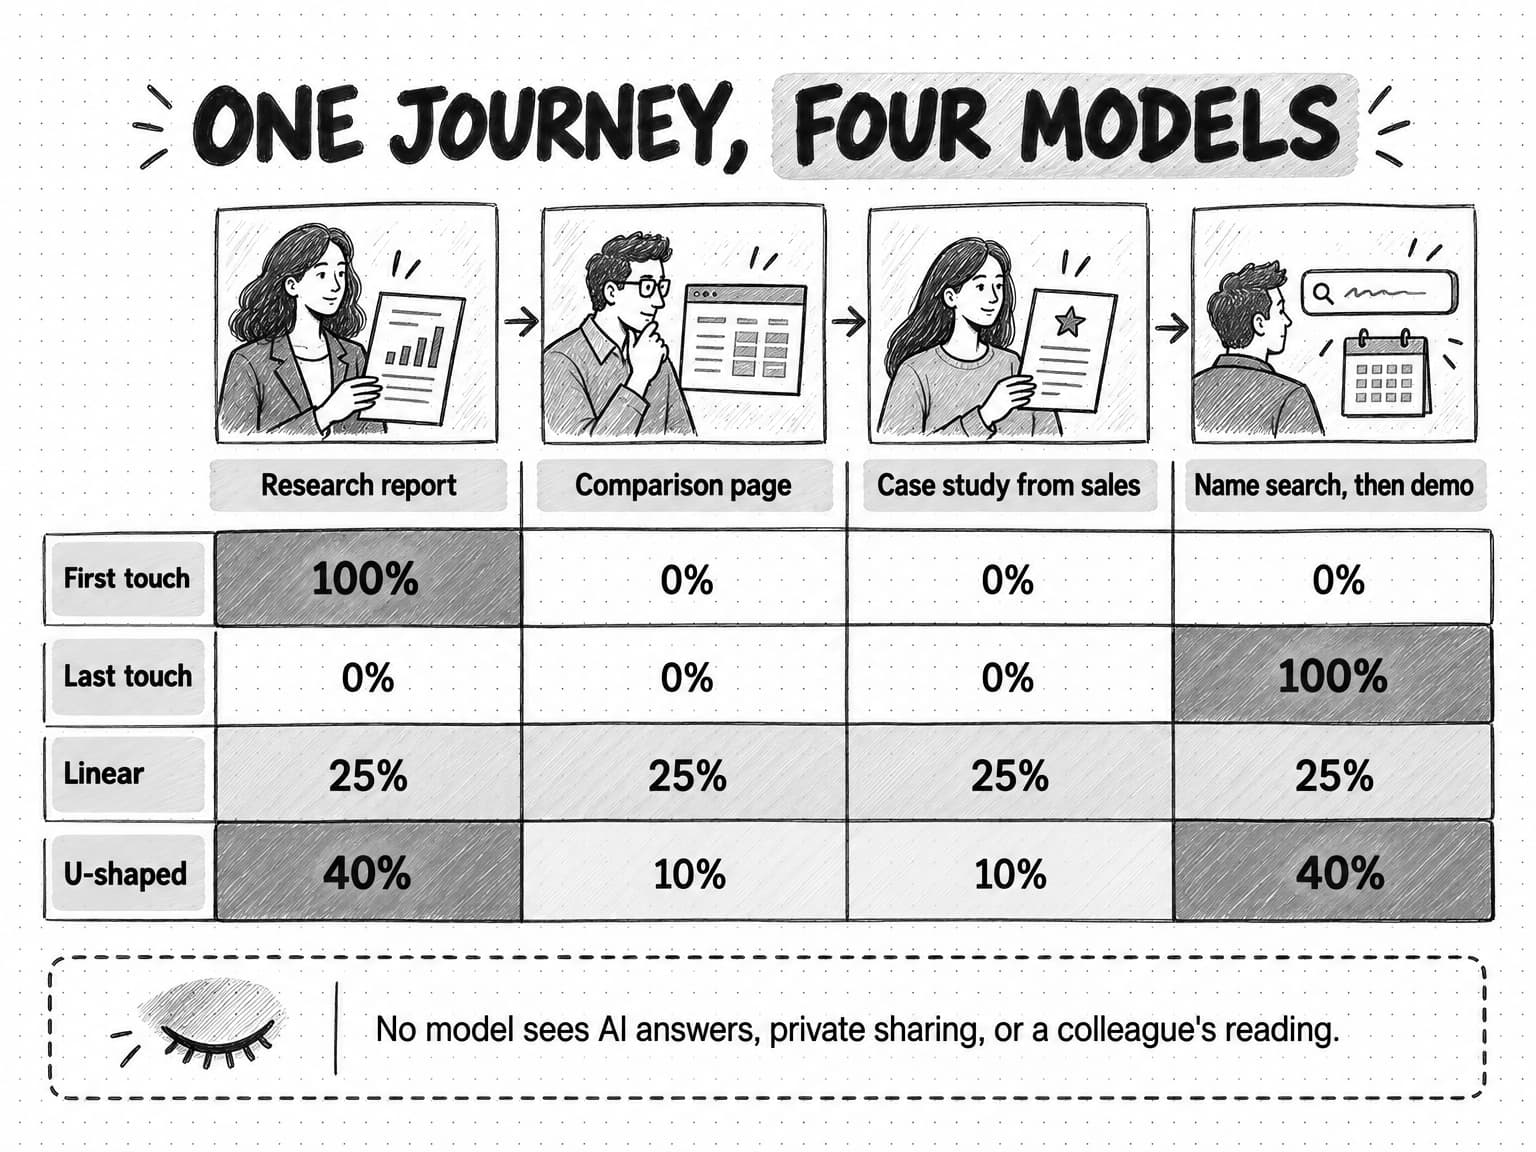
An attribution model is the rule a tool uses to divide credit for a conversion among the touchpoints that came before it. Every model is a rule, not a measurement of cause. Knowing what each rule ignores tells you which way it will distort content's apparent value.
| Model | How credit is assigned | What it tends to do to content |
|---|---|---|
| First touch | 100% to the first recorded interaction | Favors content that brings new people in, such as search articles and research; ignores everything after |
| Last touch | 100% to the last interaction before conversion | Favors branded search, direct visits, and demo pages; usually undervalues content badly |
| Last non-direct click | 100% to the last channel, ignoring direct visits | Slightly better than last touch, but still credits whatever came last |
| Linear | Equal credit to every recorded interaction | Gives content fair credit for presence, but treats a skimmed post and a decisive comparison page as equal |
| U-shaped | Most credit to the first interaction and the lead conversion, the rest spread across the middle | Rewards content that starts or converts journeys; underweights mid-funnel content |
| W-shaped | Most credit to first touch, lead creation, and opportunity creation | Closer to B2B reality, but needs clean CRM data on all three moments |
| Time decay | More credit to interactions closer to conversion | Undervalues early-stage content in long cycles |
| Data-driven | Credit distributed by a statistical model trained on your own conversion paths | Learns from observed paths only; still blind to anything unrecorded |
The definitions in tools differ slightly. HubSpot's attribution reporting documentation, last updated June 21, 2026, defines its U-shaped model as giving 40% each to the first interaction and the lead conversion interaction, its W-shaped model as giving 30% each to the first interaction, the contact-creating interaction, and the deal-creating interaction, and its time decay model as using a 7-day half-life. That half-life matters for B2B: an article read three weeks before a demo request keeps only about an eighth of the credit it would have had on the day.
Google Analytics 4 now offers fewer choices. Google's Get started with attribution page lists three models: data-driven, paid and organic last click, and Google paid channels last click. First click, linear, time decay, and position-based models were no longer available as of November 2023. GA4's attribution settings also set a key event lookback window, which defaults to 90 days for most key events and 30 days for first visits. A touchpoint older than the window gets no credit at all. With an average cycle near ten months, much of the content that shaped a deal falls outside it.
Every model, including data-driven ones, shares four blind spots that matter for content:
- Unrecorded touches. Reading in an AI answer, a LinkedIn feed, an inbox, a podcast app, or a colleague's screenshot leaves no record. A model cannot divide credit it cannot see.
- Other people in the buying group. Most tools track individuals or browsers. When one person reads and another converts, the reader's touch is lost unless your CRM links contacts to accounts and opportunities.
- Cross-device and cleared cookies. A buyer who reads on a phone and converts on a laptop looks like two people.
- Correlation, not cause. A model credits content that was present before a conversion. It cannot tell whether the deal would have happened anyway.
So use attribution models for what they are good at: comparing content assets and channels against each other with a consistent rule, and spotting changes over time. Do not use any single model's output as the value of content. Many teams look at first touch and a multi-touch model side by side; the gap between them shows how much of content's work happens in the middle of the journey.
Self-reported attribution: asking buyers what they remember
Self-reported attribution means asking buyers how they found you and recording their answer in their own words. The standard version is a required, open-text "How did you hear about us?" field on the demo or sign-up form, plus the same question in the first sales conversation, with the answer written into the CRM. Our guide to zero-click content distribution explains how to set up the field, code the answers, and avoid the common traps, so this section covers only how to use the answers in an ROI calculation.
Self-reported answers catch what software misses. A buyer whose recorded path is "organic search, branded, then demo request" may write "your benchmark report came up in our team channel" or "ChatGPT recommended you when I asked about vendors." Those answers do not prove the content caused the purchase. They are recollections, and people forget, compress several touchpoints into one, and name the most memorable source. But they reveal channels your attribution model cannot see, and the pattern across a quarter is evidence.
Use the answers three ways:
- Measure the share of hand-raisers who name content. Code each answer by channel group and by named asset where possible. "28% of demo requests this quarter named a piece of content or a founder's posts" is a useful, honest statement for a board.
- Find the gap between the two records. Count the opportunities where the buyer named content but your CRM shows no tracked content touch. That count shows, at a minimum, how much your attributed and influenced tiers miss.
- Weight the influenced tier. If self-reported answers consistently name content far more often than software attribution credits it, that is a reason to defend the share you apply to influenced pipeline, or to raise it in an agreed review. It is not a reason to add self-reported deals into ROI as a separate line, because many of them are already counted in the other tiers.
Dark social, zero-click searches, and AI answers
Three kinds of reading leave little or no trace in analytics, and all three have grown.
Dark social is sharing in private channels such as direct messages, team chat, text messages, and email. When a link is opened from an app or an email client, the visit often arrives with no referrer. Google Analytics' default channel group defines Direct as users who arrive via a saved link or by entering your URL, and that is where most dark social visits land. Some sharing never produces a visit at all: a screenshot of a chart, a quote repeated in a meeting.
Zero-click searches are searches where the user gets what they need from the results page and does not click. The Pew figures above show how AI summaries reduce clicks on informational searches. For content ROI, the effect is that an article can do its job, teaching a buyer something, without a visit.
AI answers from assistants such as ChatGPT, Gemini, Perplexity, and Copilot can summarize your content, name your company, or recommend you, with or without a link. Google Analytics now includes an AI Assistant channel in its default channel group for visits from such sources, which helps count the visits that do happen. The answers that produce no visit still need a separate method.
You cannot measure these three directly, but you can watch proxies that move when they are working:
- Branded search. Searches that include your company or product name. In Google Search Console, Google introduced a branded queries filter in November 2025 that separates them where available. Rising branded search after a content push suggests people heard of you somewhere and looked you up.
- Direct visits to deep pages. Few people type the full address of a specific article. A rise in direct traffic to deep pages often follows private sharing.
- AI answer visibility. Whether AI assistants name and accurately describe your company for a fixed set of buyer questions, checked on a schedule. Our guide to measuring AI search visibility gives a repeatable method and a tracking template.
- Self-reported mentions of shared content, podcasts, posts, or AI recommendations.
- Content mentioned in sales conversations, logged by reps.
These proxies belong in the inferred tier. Report them beside the ROI number, with the trend over several quarters, because they explain why the attributed floor understates what content did. They should not be converted into dollars and added to the return unless an incrementality test gives you a defensible conversion rate.
Leading and lagging indicators of content ROI
A lagging indicator measures an outcome after it has happened: closed revenue, pipeline, customers retained. A leading indicator moves earlier and predicts the outcome, if you have chosen it well. Content needs both, because revenue lags content by months and a team cannot wait a year to learn whether a quarter's work was useful.
| Type | Indicator | What it tells you | How soon it moves |
|---|---|---|---|
| Leading | Search impressions and rankings for target pages | Whether the content is being found | Weeks |
| Leading | AI answer mentions for a fixed question set | Whether AI assistants name and describe you | Weeks to months |
| Leading | Engaged readers from target accounts or roles | Whether the right people are reading | Weeks |
| Leading | Newsletter subscribers and replies from your target audience | Whether readers want more | Weeks |
| Leading | Saves, reposts, and comments from people who match your buyer profile | Whether the content travels among buyers | Days to weeks |
| Middle | Demo requests and trials from content pages | Whether readers take a next step | Weeks to months |
| Middle | Content touches on open opportunities | Whether buying groups use content during deals | Months |
| Middle | Assets shared by sales | Whether sales finds the content useful | Months |
| Lagging | Content-sourced and content-influenced pipeline | Commercial reach of the program | Months |
| Lagging | Closed revenue and gross profit from those deals | The return | Six months to more than a year |
| Lagging | Win rate and sales cycle length when content was involved | Whether content changes deal quality | Six months to more than a year |
Two rules keep leading indicators honest. First, pick ones you have reason to believe predict pipeline, and check that belief every few quarters by comparing them with what later closed. A leading indicator that never predicts anything is a vanity metric with a better name. Second, measure audience quality, not volume. Ten engaged readers from companies you sell to are worth more than ten thousand page views from students looking up a definition.
How to measure ROI by content type
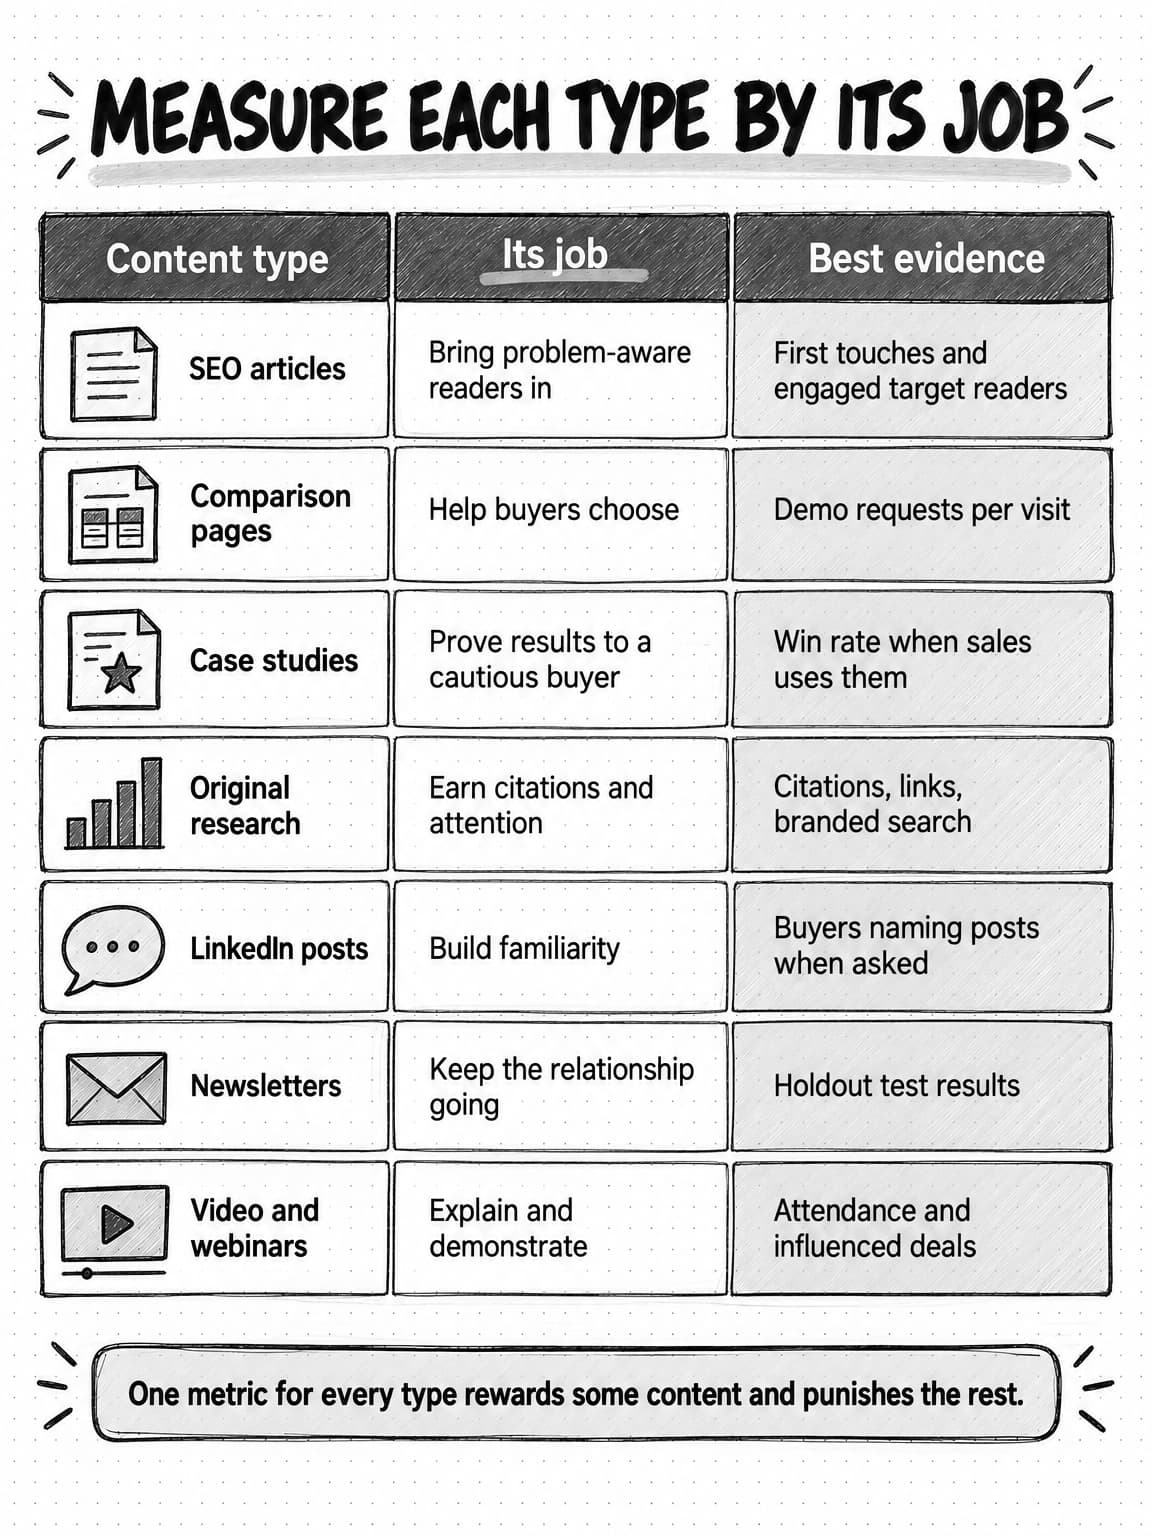
Different content does different jobs, so a single metric across all content types will reward some and punish others for reasons that have nothing to do with their value. Measure each type by the job it does in a decision.
| Content type | Main job in a deal | Leading signal | Value evidence | Main blind spot |
|---|---|---|---|---|
| SEO and educational articles | Bring problem-aware readers in and teach them | Impressions, rankings, engaged readers from target roles | First-touch opportunities, template downloads | AI summaries answer the question without a visit |
| Comparison and alternative pages | Help buyers choose among vendors | Visits from commercial queries, time on page | Trials and demo requests, high last-touch share | Buyers screenshot and share them privately |
| Case studies | Prove results to a cautious buyer | Sales usage, downloads | Influenced late-stage deals, win rate when used | Reps send PDFs that leave no trace |
| Original research | Earn citations, links, and attention | Citations, links, press mentions, AI answer mentions | Branded search lift, first touches, self-reported mentions | Most of its value is in other people's content |
| LinkedIn posts | Build familiarity with the company and its people | Engagement from target buyers, profile visits | Self-reported mentions, branded search | Native posts rarely produce a click |
| Newsletters | Keep a relationship with readers between purchases | Subscriber growth from target audience, replies | Influenced pipeline among subscribers, holdout tests | Reading happens in the inbox |
| Video and webinars | Explain and demonstrate | Completed views, registrations, attendance | Influenced deals, attendee-to-opportunity rate | Clips viewed on social platforms leave no trace |
A few notes for the types that are hardest to measure.
Comparison pages often have the clearest return of any content, because buyers read them while choosing. Measure them by conversions per visit rather than traffic. A comparison page with 200 visits and six demo requests a quarter may be the most valuable page on the site.
Case studies should be measured mostly as sales assets. Ask reps to log which case studies they send and when, then compare win rates and cycle length for opportunities where a case study was used with those where it was not. The comparison will be confounded, since reps send case studies to deals already going well, so treat it as directional.
Original research returns value mostly through other people: journalists, analysts, other companies' content, and AI answers that cite it. Count citations and links, watch branded search and self-reported mentions after launch, and expect the attributed tier to understate it heavily. Our guide to original research content covers how to make studies that get cited.
LinkedIn content mostly produces familiarity, not clicks. Measure the quality of engagement from people who match your buyer profile, and lean on self-reported attribution. Our guide to LinkedIn content strategy for B2B explains why the people posting matter more than the company page.
Newsletters are among the few content types where a clean holdout test is possible, because you control who receives each issue. The incrementality section below explains how. Our guide to B2B newsletter strategy covers building a newsletter people read.
Time lag and cohort analysis
A frequent reason content ROI looks poor is that it is measured too soon. If buying cycles run close to ten months, content published in January is still producing pipeline in the autumn and revenue the following year. A report that compares this quarter's content cost with this quarter's closed revenue is comparing two unrelated things.
Cohort analysis fixes this by grouping content by when it was published and following each group's results over time. Instead of asking "what did content produce this quarter?", you ask "what has the content we published in the first quarter produced so far, and how does that compare with the content we published in the second quarter at the same age?"
To set it up:
- Tag every asset with a publication cohort, such as 2026-Q1, in a simple content inventory: title, type, publish date, cohort, and cost.
- Record value by asset each month: attributed opportunities, influenced opportunities, and closed revenue where the asset appears in the path.
- Sum value by cohort and by age, in months since publication, not calendar months.
- Compare cohorts at the same age. Content published in the second quarter should be compared with the first quarter's content at three months old, not with the first quarter's content today.
- Calculate ROI per cohort once it matures, using the cohort's cost, and mark younger cohorts as still maturing.
The chart below shows an illustrative cohort; the numbers are not a benchmark. A quarterly report taken at the end of the publishing quarter, the highlighted point, sees a small fraction of what that cohort eventually produces.
$K pipeline
View the data
| Period | $K pipeline |
|---|---|
| M1 | 0 |
| M2 | 6 |
| M3 | 18 |
| M4 | 36 |
| M5 | 60 |
| M6 | 84 |
| M7 | 108 |
| M8 | 132 |
| M9 | 156 |
| M10 | 174 |
| M11 | 186 |
| M12 | 192 |
Illustrative figures for a fictional company, created for this guide. Not a benchmark.
Cohorts also make the conversation with a board easier. You can show that the first quarter's content has now produced a stated amount of pipeline at nine months, that the second quarter's content is ahead of where the first quarter's was at the same age, and that the third quarter's cohort is too young to judge. That is a more honest and more persuasive story than a single blended ROI figure that mixes mature and immature content.
A spreadsheet with one row per asset and one column per month of age is enough, as long as someone updates it monthly. Our guide to content operations covers keeping the content inventory this depends on.
Incrementality tests a small team can run
Attribution tells you where content appeared in the path. Incrementality asks a harder question: how many of those outcomes would not have happened without the content? The standard way to answer it is a holdout test, in which one group is exposed to the content and a comparable group is not, and the difference in outcomes is the incremental effect.
Large advertisers run formal lift studies. Google researchers described one design in Measuring Ad Effectiveness Using Geo Experiments (Jon Vaver and Jim Koehler, 2011), in which non-overlapping geographic regions are randomly assigned to a control or a treatment condition. Content teams rarely have the volume for that level of rigor, but several simpler designs are within reach.
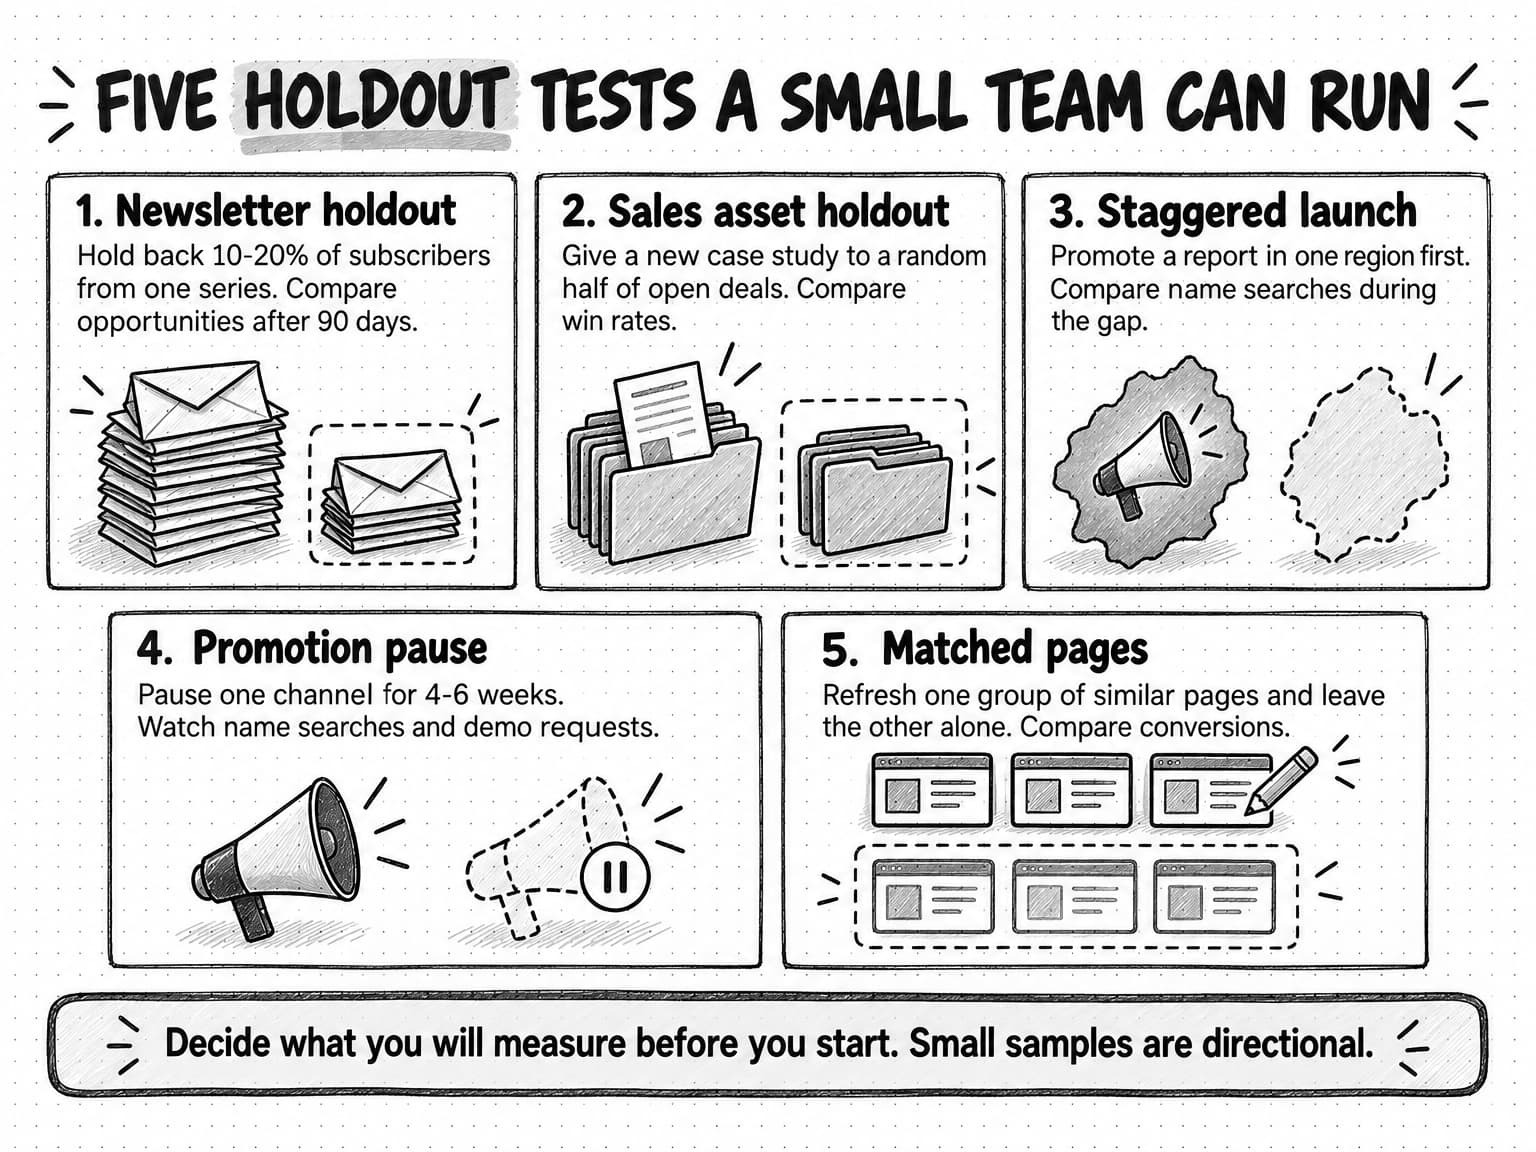
1. Newsletter holdout. Randomly hold back 10% to 20% of your newsletter list from a specific series, such as a monthly research digest, for one or two quarters. Compare demo requests, trials, and opportunities between the two groups over the following 90 days. This is the cleanest test available to most content teams, because you control exactly who receives the content. It needs a list large enough to produce conversions in both groups; with a few hundred subscribers, expect directional rather than conclusive results.
2. Sales asset holdout. When you create a new sales asset, such as an ROI guide or a case study for a specific objection, make it available to half of the sales team or half of the open opportunities for one quarter, chosen at random. Compare stage progression, win rate, and cycle length. Randomization matters: if reps choose which deals get the asset, they will choose the deals already going well.
3. Staggered launch by market or segment. Promote a major piece of content, such as a research report, in one region or customer segment first, and in a comparable one four to six weeks later. Compare branded search, direct traffic to deep pages, demo requests, and self-reported mentions between the two during the gap. This is a small version of a geo experiment.
4. Promotion pause. Pause paid promotion or regular posting on one distribution channel for four to six weeks and watch the same signals. This tests the channel rather than the content, and it costs something, so run it only on a channel you are already unsure about.
5. Matched-page test. Choose two comparable groups of existing pages, such as twenty older articles on similar topics with similar traffic. Refresh or add stronger calls to action to one group and leave the other unchanged. Compare conversions over the next quarter. This tests a content change, not content as a whole, but it is often the most useful test for a team deciding where to spend editing time.
Whichever design you choose, follow four rules. Write down before the test what you will measure, for how long, and what result would change a decision. Keep the groups comparable, ideally by random assignment. Run the test long enough for your buying cycle to show a result in the metric you chose, which often means choosing an earlier metric, such as demo requests, rather than closed revenue. And treat small samples honestly: a test with eight conversions in one group and five in the other tells you very little, however tempting the percentage difference looks.
The payoff of even one good test is that it replaces a guess. If a newsletter holdout shows subscribers convert to opportunities at a meaningfully higher rate than the held-back group, you have evidence for the newsletter's incremental value and a better basis for the share of influenced pipeline you credit to content.
Worked example: one quarter of content ROI at a fictional software company
The company, figures, and results in this example are fictional and illustrative. They show how the method fits together, not what any real company should expect.
Ridgeline is a fictional B2B software company selling workflow software to finance teams. Its average contract is $24,000 a year, its gross margin is 80%, its win rate from opportunity to closed deal is 25%, and its average customer stays three years. The content team is one content lead, freelancers, and the founder's time. The CEO has asked for the content ROI for the third quarter.
Step 1: count the full cost
| Cost line | Calculation | Quarter cost |
|---|---|---|
| Content lead | $150,000 loaded annual cost × 80% of time on content ÷ 4 | $30,000 |
| Freelance writers | 6 articles × $900 | $5,400 |
| Design and video editing | Freelance invoices | $4,000 |
| Subject-matter experts | 30 hours of founder and product time × $120 | $3,600 |
| Tools | Share of SEO, design, and analytics subscriptions | $1,800 |
| Paid promotion | LinkedIn promotion of the research report | $6,000 |
| Newsletter platform | Subscription | $300 |
| Research survey panel | $9,000 amortized over four quarters | $2,250 |
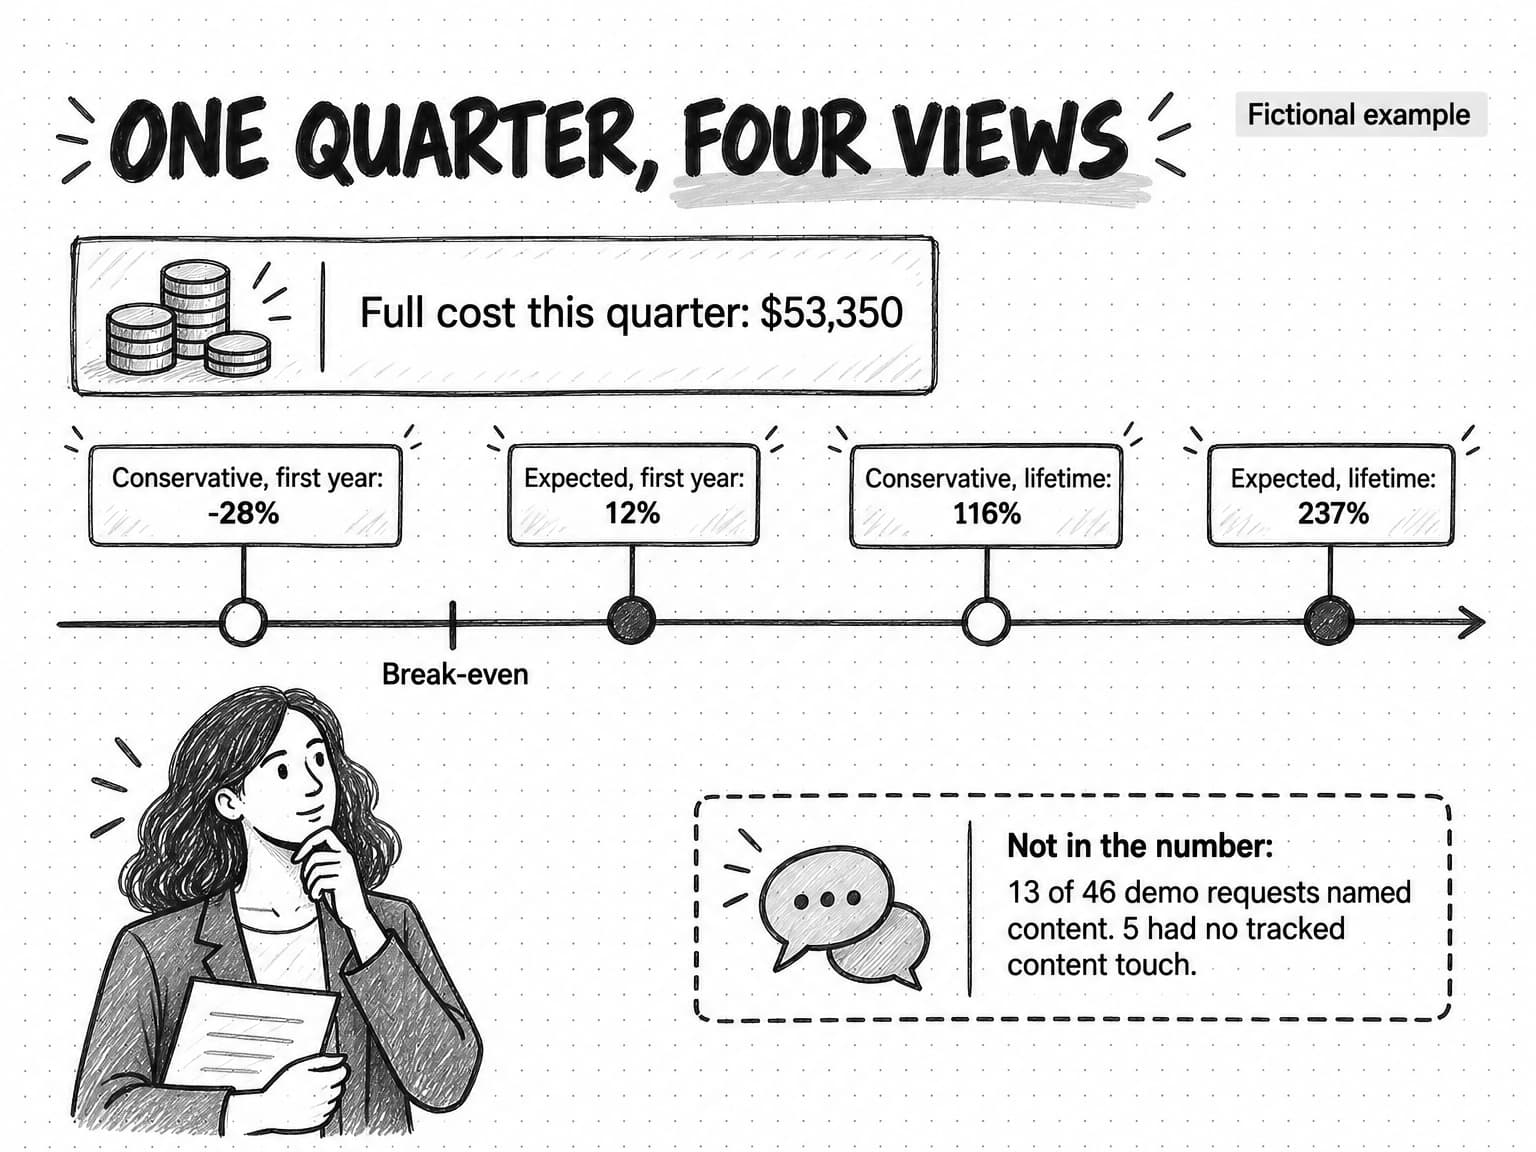
| Total | $53,350 |
Step 2: grade the return by evidence
Ridgeline's CRM links contacts to opportunities, so the team can see which buying group members engaged with tracked content. It uses opportunities created during the quarter, with a 90-day content window before opportunity creation.
- Attributed tier: 8 opportunities where content was the first touch or created the lead, worth $192,000 in pipeline.
- Influenced tier: 15 further opportunities where a buying group member engaged with tracked content or a rep logged sending a content asset, worth $360,000 in pipeline. Ridgeline credits 30% of influenced pipeline to content, a share agreed with finance at the start of the year: $108,000.
- Inferred tier: Of 46 demo requests, 13 (28%) named a piece of content or the founder's posts in the "How did you hear about us?" field. Five of those 13 had no tracked content touch at all. Branded searches in Search Console rose over the quarter. Reps sent case studies in 9 of the 14 deals that reached the final stage. None of this is added to the ROI number.
Step 3: convert pipeline to expected gross profit
Pipeline is not revenue. Ridgeline converts it using its own win rate and margin:
- Attributed: $192,000 × 25% win rate = $48,000 expected new annual revenue × 80% margin = $38,400 first-year gross profit.
- Influenced, at the 30% share: $108,000 × 25% = $27,000 expected new annual revenue × 80% = $21,600 first-year gross profit.
Over an average three-year customer lifetime, those become $115,200 and $64,800.
Step 4: report ROI as a range
| View | Value counted | ROI |
|---|---|---|
| Conservative, first year | Attributed only: $38,400 | (38,400 − 53,350) ÷ 53,350 = −28% |
| Expected, first year | Attributed plus credited influence: $60,000 | (60,000 − 53,350) ÷ 53,350 = 12% |
| Conservative, lifetime | Attributed only: $115,200 | (115,200 − 53,350) ÷ 53,350 = 116% |
| Expected, lifetime | Attributed plus credited influence: $180,000 | (180,000 − 53,350) ÷ 53,350 = 237% |
The payback period, using the expected first-year figure of $5,000 of gross profit a month, is about 10.7 months after the deals close.
Step 5: write the interpretation
The numbers alone would mislead in either direction. The conservative first-year view says content lost money; the expected lifetime view says it produced gross profit worth more than three times its cost. Ridgeline's report to the CEO says this instead:
Content cost $53,350 this quarter, including the content lead's time and the founder's review hours. Content was the first recorded touch on, or created the lead for, $192,000 of new pipeline and appeared in the buying process for another $360,000. Counting the attributed pipeline and 30% of the influenced pipeline, at our win rate and margin, we expect content to return 12% in the first year and about 237% over an average customer lifetime. The attributed floor alone pays back over a customer lifetime. Tracking missed some of content's work: 13 of 46 demo requests named our content when asked how they found us, and five of those had no tracked content touch, so we believe these figures understate the program. The third-quarter cohort is still young; we will report its results again at six and nine months.
That paragraph does four things a board can check: it states the full cost, separates what was recorded from what was estimated, names the assumption, and says what the number leaves out.
A quarterly content ROI report template
Use this template as a one-page report for a CEO, board, or finance lead. Keep the same structure every quarter, and leave the method notes at the bottom unchanged unless you deliberately change the method.
CONTENT ROI REPORT: [Quarter, year]

1. HEADLINE (two or three sentences)
   What content cost, the range of return, and the most important change since last quarter.

2. COST
   Internal people (loaded):            $
   Subject-matter expert time:           $
   Freelancers and agencies:             $
   Production and research (amortized):  $
   Tools (content share):                $
   Distribution and promotion:           $
   Total:                                $

3. RETURN, BY STRENGTH OF EVIDENCE
   Attributed pipeline:                  $      (opportunities: )
   Influenced pipeline:                  $      (opportunities: )
   Influence share applied:              %      (agreed: [date])
   Win rate / gross margin / lifetime:   % / % / years

4. ROI RANGE
                      First year    Lifetime
   Conservative           %            %
   Expected               %            %
   Payback period (expected):           months

5. WHAT THE NUMBERS LEAVE OUT
   Self-reported mentions of content:    of     hand-raisers (%)
   Of those, with no tracked content touch:
   Branded search trend (vs last 3 quarters):
   AI answer visibility (fixed question set):
   Sales use of content (deals using assets):

6. COHORTS
   Cohort     Age (months)   Cost    Pipeline to date   Status
   [Q-3]                                                 Mature
   [Q-2]                                                 Maturing
   [Q-1]                                                 Young

7. BY CONTENT TYPE
   Type   Assets   Cost   Leading signal   Attributed   Influenced   Decision
   (keep, expand, fix, or stop for each type)

8. TESTS
   Test running, what it measures, when it reports, result if finished.

9. DECISIONS FOR NEXT QUARTER
   Three lines: what we will do more of, what we will stop, what we will test.

METHOD NOTES
   Attribution window: [e.g. 90 days before opportunity creation]
   Influence rule: [definition of an influenced opportunity]
   Amortization rule: [e.g. one-off costs over $5,000 across 4 quarters]
   Data sources: [analytics, CRM, form answers, search console, AI answer checks]
Three habits make the report trusted. Send it on the same schedule, even when the quarter was weak, so it never looks like a report produced only when the numbers are good. Keep the method notes stable, and when you change one, say so in the headline and restate last quarter under the new method. And end with decisions, because a report that does not change what the team does next quarter is a cost with no return of its own. Our guide to automating marketing reporting covers how to make recurring reports people read and act on.
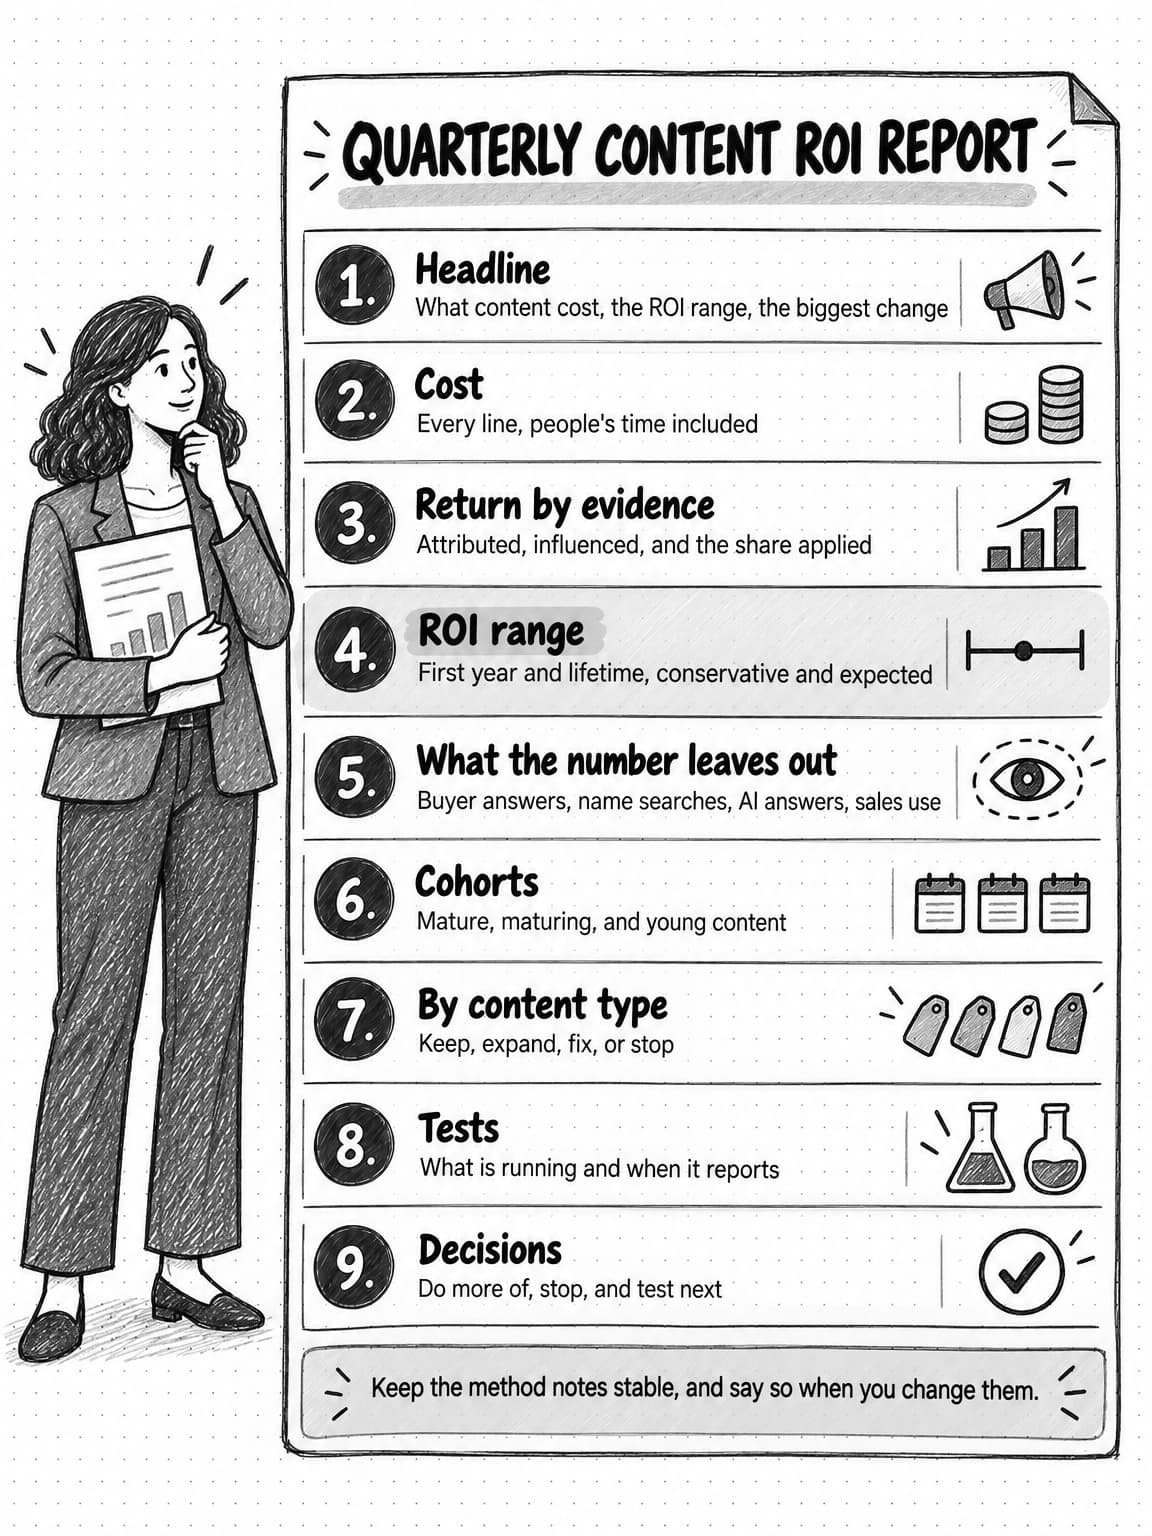
View the quarterly content ROI report reference at full size (opens in a new tab).
Common content ROI mistakes
Reporting vanity metrics as results. Page views, impressions, and follower counts say whether content was seen, not whether it helped anyone buy. They belong in the leading indicators, labeled as such, never in place of a return.
Leaving people out of the cost. Content ROI that excludes the salaries of the people who make it is not a return on content; it is a return on freelance invoices.
Using revenue instead of gross profit. Revenue overstates what the business gained. Use margin, and say so.
Double counting. Adding first-touch credit for content to last-touch credit for paid search on the same deal, so two programs each claim the whole deal. Or adding self-reported deals on top of influenced deals that already include them. Choose one model per report, apply it to every channel, and make sure each deal's credit sums to 100% across programs.
Ignoring sales assist. Case studies, comparison pages, and security documents sent by reps do real work late in deals, and attribution tools almost never see it. Ask reps to log content they send, and include it in the influenced tier.
Measuring too early. Comparing this quarter's content cost with this quarter's closed revenue in a ten-month cycle guarantees a poor result. Use cohorts.
Changing the method when the number disappoints. A new attribution model or a higher influence share every quarter makes trends meaningless and erodes trust. Change the method rarely, on purpose, and restate history when you do.
Quoting industry benchmarks as targets. Figures such as "content returns three dollars for every dollar spent" circulate widely, often without a published method, sample, or time window. Your own conservative floor, measured consistently, is a better baseline than someone else's average.
How Ampere helps with content ROI work
Ampere is an AI marketing agent that can take on much of the research, reporting, and drafting around content measurement, leaving the team's time for the judgments: which value to credit, which tests to run, and what to change. You describe the work in plain English, and Ampere does it in its own session workspace, with a browser, files, and internet access, then brings the results back for you to review.
Ampere does not connect to your analytics or CRM, and it does not run attribution models for you. What it can do is work with the data you export. Share exported spreadsheets from your analytics, CRM, and form answers, and Ampere can build the quarterly report as a spreadsheet, a document, or a presentation deck, calculate the cost and ROI range from the inputs you give it, and lay out cohorts by content type. It can help you code open-text "How did you hear about us?" answers into channel groups, keeping the buyers' original words beside each code, for you to check.
For the inferred tier, Ampere can research AI-search visibility: how AI answers describe your company and competitors for the buyer questions you care about. A scheduled task can rerun that research, or any saved prompt, on a weekly or monthly cadence and return the results to your Project, which suits the recurring checks this guide recommends. Monitoring watches can surface in-app alerts with evidence when something you track changes, such as a competitor's pages.
For the content itself, Ampere can draft blog article packages, landing pages, research reports, newsletters, and LinkedIn posts from your saved Brand memory, so the assets you measure start from your positioning, products, and voice. Ampere drafts and analyzes; your team reviews every figure and every claim, and decides what to publish.
Sources and further reading
- 6sense, 2025 Buyer Experience Report. Survey of nearly 4,000 B2B buyers across North America, EMEA, and APAC; buying cycle length, point of first contact, day-one shortlists, and LLM use. Accessed October 17, 2026.
- Forrester, The State of Business Buying, 2024, press release, December 4, 2024. Buying-group size and departments involved.
- Athena Chapekis and Anna Lieb, Google users are less likely to click on links when an AI summary appears in the results, Pew Research Center, July 22, 2025. Browsing data from 900 U.S. adults, March 2025; 68,879 unique searches.
- Robert Rose, B2B Content and Marketing Trends: Insights for 2026, Content Marketing Institute and MarketingProfs, October 8, 2025. Survey of 1,015 B2B marketers, June 24 to August 14, 2025; sponsored by Storyblok.
- Google Analytics Help, Get started with attribution. Available attribution models and the November 2023 removal of rule-based models. Accessed October 17, 2026.
- Google Analytics Help, Select attribution settings. Key event lookback windows. Accessed October 17, 2026.
- Google Analytics Help, Default channel group. Direct and AI Assistant channel definitions. Accessed October 17, 2026.
- HubSpot Knowledge Base, Understand attribution report definitions, last updated June 21, 2026. Credit splits for multi-touch models.
- Google Search Central, Introducing the branded queries filter in Search Console, November 2025.
- Jon Vaver and Jim Koehler, Measuring Ad Effectiveness Using Geo Experiments, Google, 2011.
Frequently Asked Questions
What is the formula for content marketing ROI?
The formula for content marketing ROI is the value attributed to content minus the full cost of content, divided by that cost, multiplied by 100. Use gross profit rather than revenue for the value, and include internal salaries, subject-matter expert time, freelancers, tools, and distribution in the cost. A result of 100% means content returned twice its cost.
What is the definition of marketing ROI?
Marketing ROI is the profit a marketing activity produces relative to what it cost, usually expressed as a percentage: the gain minus the cost, divided by the cost. Content marketing ROI applies the same idea to content. The definition is simple; the difficulty is deciding which costs and which share of revenue genuinely belong to the activity being measured.
What is a good content marketing ROI?
A good content marketing ROI is one that stays positive on a conservative, consistently measured basis and improves from cohort to cohort. Widely quoted industry figures rarely publish their method, sample, or time window, so they make poor targets. In B2B, judge ROI over a customer lifetime and by cohort, because first-quarter results understate content that keeps producing pipeline for a year.
How do you attribute revenue to content marketing?
Attribute revenue to content marketing by grading it by strength of evidence. Count deals where content was the first recorded touch or created the lead in full. Credit an agreed, stable share of deals where buying group members engaged with tracked content. Report self-reported mentions, branded search, and AI answer visibility beside the ROI figure rather than inside it.
What metrics measure content marketing success?
Content marketing success is measured with leading and lagging metrics together. Leading metrics include search impressions, AI answer mentions, engaged readers from target accounts, and newsletter replies. Middle metrics include demo requests from content pages and content touches on open deals. Lagging metrics are content-sourced and content-influenced pipeline, closed revenue, gross profit, and win rate when content was used.
What is a content attribution model?
A content attribution model is the rule an analytics or CRM tool uses to divide credit for a conversion among the content and other touchpoints before it. Common models are first touch, last touch, linear, U-shaped, W-shaped, time decay, and data-driven. Every model only sees recorded touches, so all of them miss AI answers, private sharing, and colleagues' reading.
How do you measure content marketing ROI for a SaaS company?
Measure content marketing ROI for a SaaS company with gross profit over the average customer lifetime, not first-month revenue, because subscription revenue arrives over years. Link CRM contacts to opportunities so buying group reading is visible, use a lookback window that fits your sales cycle, track content by publication cohort, and report a conservative and an expected ROI side by side.
How do you measure content marketing ROI beyond direct sales?
Content marketing ROI beyond direct sales comes from influenced pipeline, sales assist, and customer value. Track content touches on open opportunities, ask reps to log the case studies and guides they send, and compare win rates when content was used. Ask buyers how they heard about you, and watch branded search and AI answer mentions as corroborating signals.
What should a content marketing ROI report include?
A content marketing ROI report should include the full cost by line, the return split into attributed and influenced tiers, the assumptions used to convert pipeline into gross profit, an ROI range for the first year and the customer lifetime, the signals the number leaves out, results by content type and cohort, running tests, and three decisions for next quarter.