Clay marketing teardown: a measured audit of its content, ads and video
We examined Clay's website, ads, social posts and videos to understand how its marketing works in practice, and what other teams can learn from it.
24 min readWritten by Ampere
Contents
- What we found
- Most of clay.com is not the blog
- What Clay publishes in its largest website directories
- Clay's LinkedIn feed mixes humor with product updates
- How Clay changes its ad message between Google and LinkedIn
- YouTube shifted from short lessons to live events
- Clay's marketing activity over the last six months
- Product examples and education recur across Clay's channels
- What marketing teams can learn from Clay
- How we did this research
Clay helps sales teams do the research and preparation that sit behind an outreach campaign. Give it a list of companies, and it can pull facts from a few hundred data providers, run AI agents over the results, and send what it finds to the tools the team already uses. In early 2025, Clay described itself as "a data enrichment tool, a way for GTM teams to get cleaner lists." GTM means go-to-market: sales, marketing and the operations that support them. Its description has since expanded to helping people "build systems that grow revenue across data, agents, orchestration, execution, and governance."
That change in language reflects how much the company has grown. Founded in 2017, Clay spent six years on product before going, by its own account, from $1M to $100M in annual recurring revenue in two years. It raised $100M at a $3.1B valuation in August 2025; a January 2026 employee tender priced it at $5B. Clay also gave a name to the person building these systems: the GTM engineer, who automates work a revenue team would otherwise do manually. The title has since appeared in real job postings, extending Clay's influence beyond how people describe its software to how they describe their own work.
For marketers, that makes Clay an interesting company to study. Its growth is often discussed through community building, founder-led content and category creation. Interviews and conference talks help explain the thinking behind those efforts. To understand what another team could learn from them, though, we wanted to see the work itself: what Clay publishes, how often it publishes, and how its message changes from one channel to another.
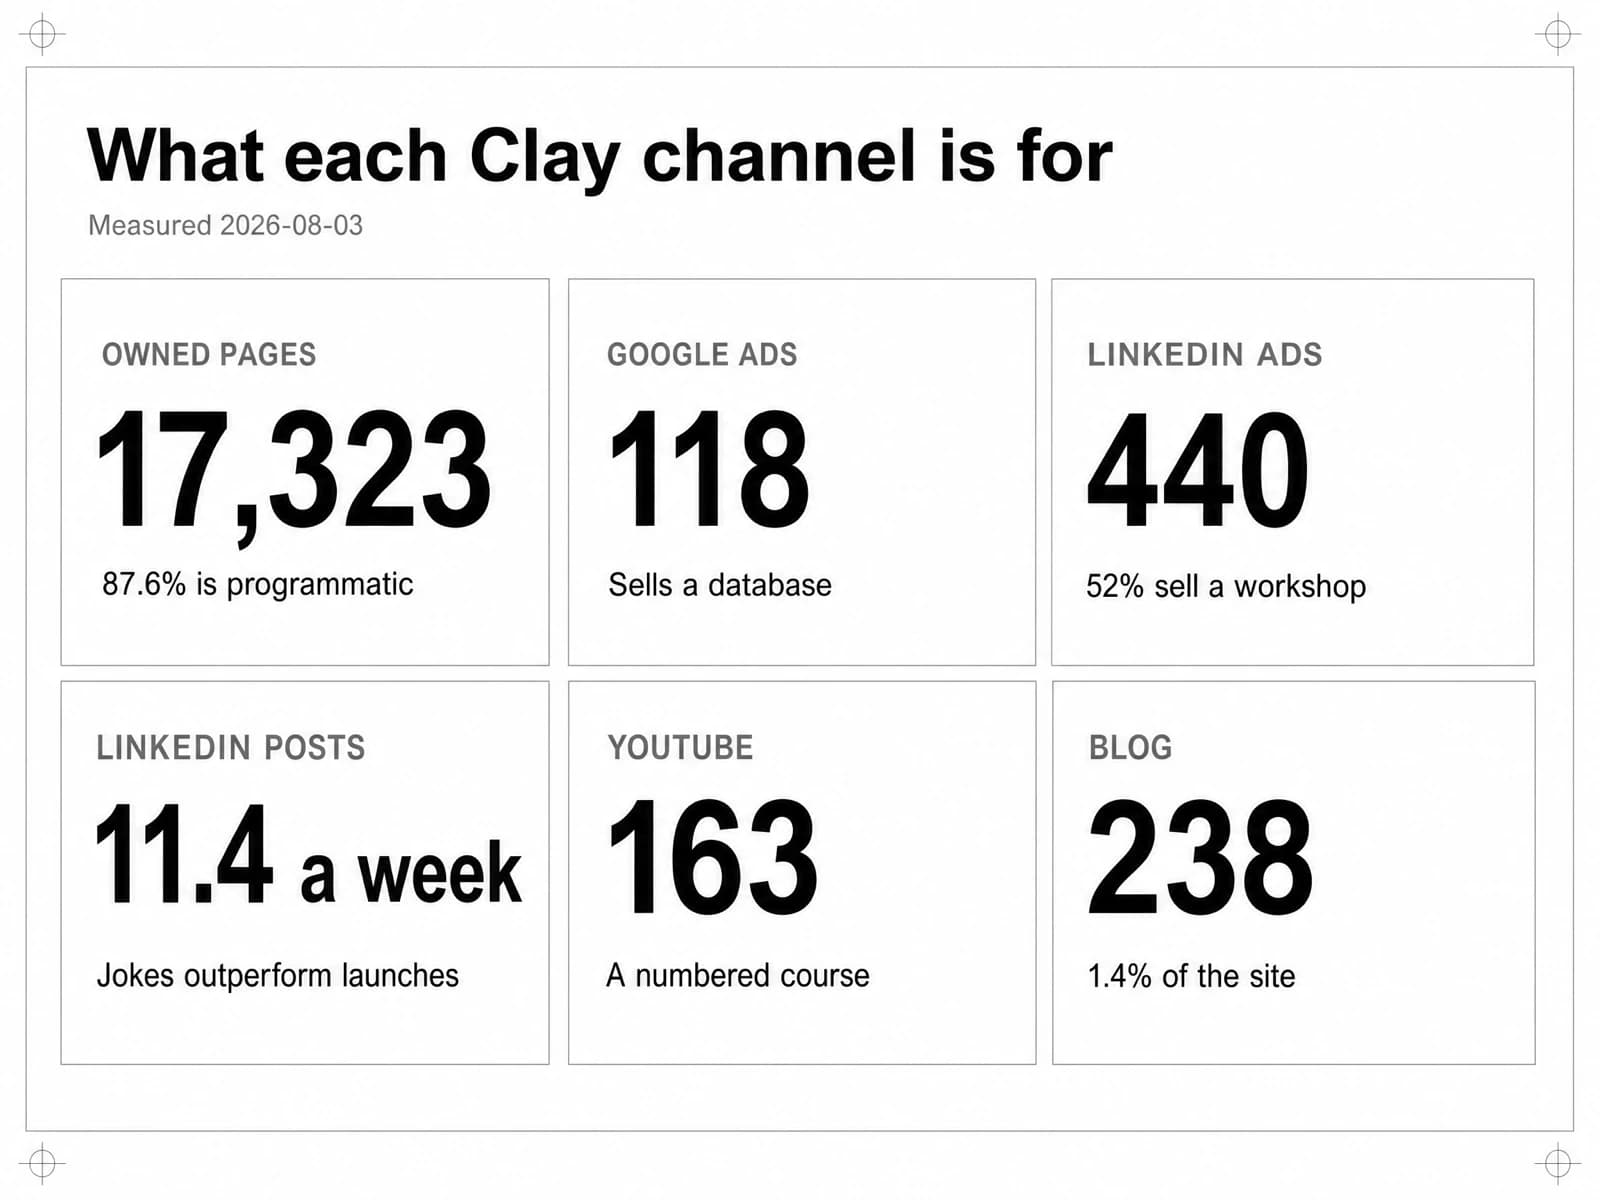
Ampere collected the public marketing artifacts we could reach across nine of Clay's surfaces: 17,323 URLs on its own domain, 67 LinkedIn posts with engagement data, 440 LinkedIn ad creatives, 118 Google ad creatives carrying 287 text variations, 163 YouTube videos, 249,086 words of transcript, its entire Instagram history, and 125,219 archive records showing when pages first appeared. Reading these together reveals a much more specific marketing operation than the familiar description of a company with a strong community.
What we found
Several findings help explain how the channels fit together. The website contains a large library of product-generated answers, while social and video give people reasons to spend time learning how to use Clay.
- Clay's blog is 1.4% of its site. Three programmatic directories (templated pages generated from data, not written) are 87.6%.
- The largest of those directories, at 10,345 pages, answers four questions: email format, funding, executives, offices.
- A second directory, 3,335 pages, is one personalized landing page per target company.
- On LinkedIn, 52% of ad creatives invite you to a live workshop or stream. On Google, 1% does.
- YouTube holds 249,086 words of transcript, and its dominant format is a numbered course with named frameworks.
- That channel has published two videos since October 2025, and they are its two longest broadcasts ever.
Most of clay.com is not the blog
The first surprise is the size of the website outside the blog. Clay's sitemap contained 17,323 URLs when we captured it on August 3, 2026. Only 238 of those were blog posts, or 1.4% of the domain. An audit focused on the editorial calendar would therefore miss most of what Clay makes available to searchers.
Three programmatic directories account for the majority of the site. These are pages produced from a template and a data source, rather than written individually: /dossier holds 10,345 pages, /gift holds 3,335, and /integrations holds 1,493. Together, they represent 87.6% of every URL on the domain. Understanding the purpose of those templates matters more here than counting how many articles the company publishes each month.
| Total sitemap URLs | 17,323 |
|---|---|
| /dossier | 10,345 (59.7%) |
| /gift | 3,335 (19.3%) |
| /integrations | 1,493 (8.6%) |
| /blog | 238 (1.4%) |
| Everything else | 1,912 (11.0%) |
The archive gives us a view of how these directories developed. /dossier grew from 37 archived pages in July 2024 to 7,113 by May 2025. Most of that expansion happened within about ten months, followed by a year in which the archived count was essentially flat. That is a different publishing pattern from an editorial team steadily adding individual articles.
pages first archived
View the data
| Period | pages first archived |
|---|---|
| 2024-07 | 37 |
| 2024-08 | 217 |
| 2024-09 | 546 |
| 2024-10 | 1011 |
| 2024-11 | 1219 |
| 2024-12 | 1812 |
| 2025-01 | 2913 |
| 2025-02 | 3167 |
| 2025-03 | 3890 |
| 2025-04 | 5898 |
| 2025-05 | 7113 |
| 2025-06 | 7924 |
| 2025-07 | 7934 |
| 2025-08 | 7944 |
| 2025-09 | 7949 |
| 2025-10 | 7955 |
| 2025-11 | 7959 |
| 2025-12 | 7977 |
| 2026-01 | 7985 |
| 2026-02 | 7987 |
| 2026-03 | 7991 |
| 2026-04 | 7991 |
| 2026-05 | 7992 |
| 2026-06 | 7998 |
| 2026-07 | 8022 |
| 2026-08 | 8023 |
Source: Internet Archive CDX API, first-capture timestamps joined against clay.com's sitemap. Captured 2026-08-03. First capture is a lower bound on publication date, so the true curve sits at or to the left of this one. About a fifth of today's dossier pages have no archive capture at all, which is why the curve tops out below the current total.
The newer /gift directory expanded even faster. Its first archived page appears in November 2025; by May 2026, the archive contains 2,878 pages. In seven months, it had grown to nearly three thousand pages, suggesting another concentrated publishing effort rather than an ongoing article-by-article schedule.
The archive also contains 4,848 pages under /number-of-employees that no longer appear in Clay's current sitemap, along with 608 under /customer-pages and 361 under /experts. These older directories are useful context: the current website is the result of additions and removals over time. Their absence from the sitemap does not tell us why Clay removed them or how they performed.
What Clay publishes in its largest website directories
The page counts tell us where Clay has concentrated its publishing. Looking inside the directories explains what that publishing is for. We sampled the templated pages to examine their content, and classified the entire /dossier directory using its URL slugs.
At 10,345 pages, /dossier is the largest directory. Its slugs identify the question each page answers, allowing us to count the question types across the whole directory rather than estimate their distribution from a sample.
| Email format (…-email-format) | 5,028 pages (48.6%) |
|---|---|
| Funding and investors (…-funding) | 2,534 pages (24.5%) |
| Executives and leadership (…-ceo, -cto, -cfo, -executives) | 2,235 pages (21.6%) |
| Office locations (…-locations) | 544 pages (5.3%) |
| Everything else | 4 pages |
Four question types cover 10,341 of 10,345 pages. The titles read like the questions themselves: Who is the CEO of 0x in 2026? Will Warren's Bio. How Much Did Altruist Raise? Funding & Key Investors. Australia Post Email Format 2026 — Find the Right Pattern.
These are also the kinds of answers Clay's enrichment product returns: email addresses, funding events, executive names and company locations. Someone searching for one company can find a useful answer without first learning what Clay is. The page then introduces the broader product through the call to action, "Get access to more people and company data using Clay." The connection between the information on the page and the product being offered is immediately understandable.
The largest content asset Clay owns is a public sample of what its product does.
Clay even has an entry in its own directory. The page at clay.com/dossier/clay-funding, titled How Much Did Clay Raise? Funding & Key Investors, uses the same template as the other 10,344 pages and ends with a "Use Clay to Get Funding Data" block. It appeared in search results for Clay's funding history on our capture date. This is a useful example of the template in practice: a specific company question leads to a page that both answers it and introduces a way to research other companies.
The /gift directory serves a different purpose. Every one of the twenty pages we sampled uses the headline Michelangelo had marble, Marketing has Clay, but the details underneath are tailored to a target company. The slugs include 10x-genomics, 1worldsync and 360learning. A life-sciences target is invited to "close more customers like Broad Institute, Memorial Sloan Kettering Cancer Center, and Allen Institute," while an apparel target sees "VF Corporation, The North Face, and New Balance." The examples make the proposed use of Clay more relevant to the company receiving the page.
Across roughly three thousand pages, this amounts to an account-specific landing-page program. Clay also publishes a template on the same domain called Auto-generate personalized landing pages for all prospects, explaining how someone else could create that kind of campaign.
Other directories help visitors find a particular task or understand a term. The 1,493 /integrations pages describe actions Clay can take in another tool, including Enrich a company's investors with Crunchbase and Add contact to sequence with Apollo.io. The 237 /tools pages cover tasks such as How to find company growth rate with AI. The 268 definitions in /glossary range more broadly, including What is Docker? and What is Cross-Site Scripting? These directories give Clay many distinct entry points for people researching a workflow.
The blog has a more familiar search-oriented structure. Of 70 sampled posts, 45 carry a year in the title, including AI Lead Scoring: Definition, Benefits & How It Works 2026 and B2B Cold Email Deliverability: 21 Best Practices 2026. Roughly a third are how-to guides and a sixth are comparison and alternatives pages. Together with the April 2026 refresh, this suggests an evergreen library that Clay updates over time. It has a clear role, but it is a small part of the company's total website publishing.
LinkedIn gives us a different view of Clay. Here, the company combines detailed product communication with posts that are much more casual than the material on its website.
Clay's LinkedIn feed mixes humor with product updates
Clay's LinkedIn page has 179,890 followers. In the 41 days we could reach, June 24 to August 3, 2026, the company published 67 posts, a rate of 11.4 per week, hitting six posts in a single day at peak. Those 67 posts drew 15,028 reactions and 2,114 comments. Not one of them has zero comments.
The typical post received fewer reactions than the average suggests: the median was 125, compared with a mean of 224. A handful of highly popular posts pulled the average upward. Separating the posts by subject shows where that happened.
| Brand / humor (26 posts) | 341 average reactions |
|---|---|
| Product announcements (9 posts) | 223 average reactions |
| Events and webinars (11 posts) | 149 average reactions |
| Hiring (4 posts) | 135 average reactions |
| Education and tutorials (17 posts) | 115 average reactions |
These figures describe visible engagement, including any paid distribution. Some company posts also ran as ads; the public totals do not separate paid and organic reactions.
The most-reacted-to post in the window begins "you ever just" and follows it with roughly two hundred letter As. It received 1,372 reactions and 143 comments. Next came a fake sports-trade bulletin announcing that LeBron James "will not return for Q3 and will instead take his talents to the Philadelphia 76ers," with 1,354 reactions. A version of the joke published two weeks earlier, in which LeBron leaves the Lakers to become "a Forward Deployed GTME," received 1,153. Humor was a substantial part of this feed, and these posts drew its largest visible responses.
The writing also falls into two distinct lengths. Of 65 posts containing text, 11 are under 120 characters and 33 are over 600, with a median of 618. Reading them explains why: Clay uses short posts for jokes and observations, and longer ones when it has something substantial to explain.
The short posts include "pov: you locked tf in.", "2020 was 2020 days ago." and "clocking in for my 9-5 before my 5-9." The longer posts are detailed product updates, with numbered lists and bold Unicode headers; one format names eight releases and explains each. There is little middle-length commentary or repackaged blog material. Readers encounter either a quick moment of recognition or a fuller account of what has changed in the product.
Only 7 of the 65 text posts include a link. Most of the material can therefore be consumed within LinkedIn itself. Readers can get the joke or read the product update without opening another page.
Clay's feed makes room for both humor and detailed product updates, at a cadence of 11.4 posts a week.
The useful lesson is how these formats coexist. The humor does not have to carry the product explanation, because the longer updates provide that elsewhere in the feed. Nor does every update need to entertain in the same way as a joke. A team can use this distinction at a lower publishing frequency too: decide what each post should do, and assess it accordingly. The engagement numbers show which posts attracted reactions, not which contributed the most to sales.
This analysis covers the company page. Clay's founders also publish from personal accounts, which the company-activity APIs used here do not return.
How Clay changes its ad message between Google and LinkedIn
Clay's writing about its executive social program describes it as "all organic with no paid spend," and characterizes the paid element elsewhere as "a modest paid push, usually a thirty-second cut of a longer video dropped onto Instagram," where "the cost is tiny." On the same blog, Clay has published a post titled How Clay Uses Clay Ads: From $250 to $25 CPL — cost per lead — describing a continuously synced LinkedIn and Meta advertising operation built on enriched customer-record audiences.
These descriptions concern different programs. Looking at the ad libraries alongside them fills in the paid side of Clay's marketing: a continuing stream of creatives that complements its organic activity.
In the Google Ads Transparency Center, advertiser Clay Labs has run 118 creatives with a first appearance of January 18, 2024, split 59 text, 43 video, and 16 image. Activity is bursty: three months account for nearly half of all 118 creatives, with clear pushes in June 2025, November 2025, and June 2026.
new ad creatives
View the data
| Period | new ad creatives |
|---|---|
| 2024-01 | 3 |
| 2024-02 | 0 |
| 2024-03 | 0 |
| 2024-04 | 1 |
| 2024-05 | 0 |
| 2024-06 | 0 |
| 2024-07 | 0 |
| 2024-08 | 0 |
| 2024-09 | 2 |
| 2024-10 | 1 |
| 2024-11 | 0 |
| 2024-12 | 3 |
| 2025-01 | 0 |
| 2025-02 | 0 |
| 2025-03 | 0 |
| 2025-04 | 1 |
| 2025-05 | 6 |
| 2025-06 | 18 |
| 2025-07 | 4 |
| 2025-08 | 0 |
| 2025-09 | 0 |
| 2025-10 | 2 |
| 2025-11 | 19 |
| 2025-12 | 6 |
| 2026-01 | 1 |
| 2026-02 | 13 |
| 2026-03 | 6 |
| 2026-04 | 1 |
| 2026-05 | 3 |
| 2026-06 | 19 |
| 2026-07 | 9 |
Source: Google Ads Transparency Center, advertiser Clay Labs (AR02473231714533507073), all 118 creatives. Dated by firstShown. Captured 2026-08-03.
LinkedIn has nearly four times the creative volume. Monthly queries of its Ad Library across the year to August 3, 2026 returned 440 distinct creatives, with between 59 and 134 live in a given month. The pace increased in 2026: 250 new creatives appeared in its first seven months, compared with 58 in the final four months of 2025. July was the busiest month, with 62 new creatives.
new ad creatives
View the data
| Period | new ad creatives |
|---|---|
| 2025-09 | 5 |
| 2025-10 | 6 |
| 2025-11 | 10 |
| 2025-12 | 37 |
| 2026-01 | 5 |
| 2026-02 | 38 |
| 2026-03 | 59 |
| 2026-04 | 27 |
| 2026-05 | 32 |
| 2026-06 | 27 |
| 2026-07 | 62 |
Source: LinkedIn Ad Library, advertiser company 13018048, queried in monthly windows; each creative attributed to the first window it appears in. The August 2025 observation window is excluded because everything live at the start of observation would register as new. Captured 2026-08-03.
The ad copy shows how the offers differ between channels. We classified it using the same keyword rules for Google and LinkedIn.
| Invites you to a live workshop or stream | LinkedIn 52% · Google 1% |
|---|---|
| Names a customer | LinkedIn 18% · Google 0% |
| Uses category or competitor keywords (best, alternative, top 10) | LinkedIn 18% · Google 65% |
| Uses database language (data, contacts, providers, records) | LinkedIn 55% · Google 73% |
| Asks for a demo or signup | LinkedIn 14% · Google 15% |
Data appears frequently on both channels, as we would expect from Clay's product. On LinkedIn, about half the creatives invite people to an event and about a fifth name a customer. On Google, roughly one in a hundred mentions an event, and none of the text variations names a customer. Category or competitor terms appear at nearly four times the LinkedIn rate. Direct asks occur at similar rates, about one in seven; the difference is in the reasons the ads give people to respond.
Google's copy emphasizes the data a buyer can obtain. The most-repeated headline, appearing 111 times, is Clay | Best GTM Data. The most-repeated description appears 115 times: "Give your sales teams a winning edge with the best data around." Other headlines include Best B2B Email Finder, Find Emails Instantly — Verified B2B Email Database and Track Buyer Intent Now. The supply claims are concrete: 850M contacts, 60M companies and 100+ data sources. None of the 287 text variations names a customer. Almost all the ads lead to the homepage or a dedicated /clay-for-gtm-ops landing page.
LinkedIn gives people a scheduled opportunity to see what they could do with Clay. Its most-repeated headline, used 28 times, is "Join the launch livestream for a first look!" Workshop invitations cover lead conversion on March 12, account scoring on April 2, re-engaging closed-lost data on June 3, and building an agent that prepares reps for accounts on July 8. Openings such as "B2B Marketers —", "RevOps leaders -" and "Marketers -" identify the audience before describing a problem. Named customers, including Verkada, Rippling, OpenAI, Anthropic, Figma and Intercom, give those applications recognizable examples.
Google's ads emphasize access to data. LinkedIn's ads show people what they could do with it through workshops and customer examples.
A plausible explanation is the context in which people encounter each ad. Someone searching for "best B2B email finder" has already expressed a specific need, so coverage and data availability are relevant reasons to consider a vendor. A person browsing LinkedIn may have the same underlying problem without actively shopping for a solution. A workshop on that problem gives them a reason to engage. The copy fits those different situations without requiring Clay to change what the product actually does.
The paid program also overlaps directly with the company feed. 345 of the 440 LinkedIn creatives are sponsored status updates: existing posts receiving paid distribution. This helps explain why the ads often read like organic content. It also means the engagement totals above include activity whose paid and organic contributions cannot be separated from outside.
YouTube shifted from short lessons to live events
A quick look at Clay's YouTube channel could lead to the wrong conclusion about its activity. The channel, @GrowWithClay, reports 16,500 subscribers and 762,940 lifetime views. Its Videos tab returns 157 videos, the latest dated October 24, 2025. Viewed only through that tab, the channel appears to have been silent for nine months.
Past live broadcasts are excluded from that view. The underlying upload playlist contains 163 videos, adding six live streams, including one published July 24, 2026, ten days before our capture. Including those broadcasts changes both the timeline and our understanding of what Clay now uses YouTube for.
videos published
View the data
| Period | videos published |
|---|---|
| 2023-03 | 13 |
| 2023-04 | 1 |
| 2023-05 | 0 |
| 2023-06 | 45 |
| 2023-07 | 3 |
| 2023-08 | 2 |
| 2023-09 | 2 |
| 2023-10 | 4 |
| 2023-11 | 1 |
| 2023-12 | 2 |
| 2024-01 | 3 |
| 2024-02 | 7 |
| 2024-03 | 6 |
| 2024-04 | 8 |
| 2024-05 | 5 |
| 2024-06 | 9 |
| 2024-07 | 6 |
| 2024-08 | 5 |
| 2024-09 | 1 |
| 2024-10 | 1 |
| 2024-11 | 0 |
| 2024-12 | 2 |
| 2025-01 | 3 |
| 2025-02 | 23 |
| 2025-03 | 0 |
| 2025-04 | 4 |
| 2025-05 | 1 |
| 2025-06 | 0 |
| 2025-07 | 1 |
| 2025-08 | 0 |
| 2025-09 | 1 |
| 2025-10 | 2 |
| 2025-11 | 0 |
| 2025-12 | 0 |
| 2026-01 | 0 |
| 2026-02 | 0 |
| 2026-03 | 0 |
| 2026-04 | 0 |
| 2026-05 | 1 |
| 2026-06 | 0 |
| 2026-07 | 1 |
Source: ScrapeCreators YouTube video-details API, @GrowWithClay, all 163 uploads reconciled across the Videos tab (157), live-streams playlist (6) and Shorts playlist (0). Dates are exact ISO timestamps, not relative labels. Captured 2026-08-03.
Even the complete video count shows a steep decline in publishing frequency. But frequency alone misses the change in format. The same history, measured in published minutes, looks quite different.
minutes published
View the data
| Period | minutes published |
|---|---|
| 2023-03 | 86 |
| 2023-04 | 12 |
| 2023-05 | 0 |
| 2023-06 | 211 |
| 2023-07 | 16 |
| 2023-08 | 5 |
| 2023-09 | 24 |
| 2023-10 | 43 |
| 2023-11 | 8 |
| 2023-12 | 16 |
| 2024-01 | 20 |
| 2024-02 | 49 |
| 2024-03 | 35 |
| 2024-04 | 99 |
| 2024-05 | 33 |
| 2024-06 | 66 |
| 2024-07 | 34 |
| 2024-08 | 33 |
| 2024-09 | 7 |
| 2024-10 | 5 |
| 2024-11 | 0 |
| 2024-12 | 15 |
| 2025-01 | 41 |
| 2025-02 | 104 |
| 2025-03 | 0 |
| 2025-04 | 17 |
| 2025-05 | 9 |
| 2025-06 | 0 |
| 2025-07 | 160 |
| 2025-08 | 0 |
| 2025-09 | 61 |
| 2025-10 | 14 |
| 2025-11 | 0 |
| 2025-12 | 0 |
| 2026-01 | 0 |
| 2026-02 | 0 |
| 2026-03 | 0 |
| 2026-04 | 0 |
| 2026-05 | 231 |
| 2026-06 | 0 |
| 2026-07 | 231 |
Source: same 163 uploads, summing durationMs per publication month. One 2024 record is a live-stream placeholder that never broadcast and carries no duration; it is excluded. Captured 2026-08-03.
May 2026 and July 2026 are the two largest months by published minutes, despite containing only one video each. Both broadcasts are Clay Cup, a live tournament with 32 competitors and a $50,000 prize. Each runs for roughly 231 minutes, so a single event accounts for far more viewing material than the channel's earlier short lessons.
Through October 2025, Clay published 161 videos averaging 7.6 minutes. Since then, its two videos have averaged 231 minutes, thirty times longer. Calling this simply a reduction in output would overlook the move from short instructional videos to extended live programming.
Clay's two biggest months by published minutes came after it stopped regularly uploading short videos.
The transcripts explain what the channel was before it changed. Across 158 videos and 249,086 words, the dominant format is instruction. Forty-three titles begin "How to," and fifty-five either begin that way or carry the word tutorial, walkthrough, or guide. Twenty are numbered lessons in an explicit course, beginning at Clay 101 | Lesson 1: The FETE Framework and running as far as Lesson 23. All twenty are taught by the same narrator, opening with the same line: "hey it's Yash and in this lesson we're going to cover…"
The lessons teach named, proprietary frameworks, including FETE, Jigsaw and S.P.I.C.E. for prompt engineering. Across a quarter of a million words, common phrases include we're going, right here, you'll see, company domain and clay table. These are the expressions of someone walking a viewer through work on a screen. Taken together with the numbered lessons, they show how much of the channel was devoted to a structured curriculum.
Alongside those lessons, Clay published first-person experiments with broader appeal. I sent 10,000,000 cold emails and learned this is the channel's most-viewed video, with 182,908 views. Other titles include I Emailed 100 Celebrities. Here's Who Replied., I Tested Every Cold Email Script so You Don't Have To. and I Let AI Train Me For a Marathon. These videos barely mention Clay. Their subject and presentation give people a reason to watch even if they are not looking for a product tutorial.
The tutorial work appears to have shifted toward university.clay.com, where 771 pages first appear in the archive between April 2024 and March 2026, overlapping the slowdown in YouTube lessons. YouTube, meanwhile, has continued as a venue for live events. For an audit, the distinction matters: a report based only on uploads per month could recommend restarting tutorials without noticing the growing education property or the longer broadcasts.
Clay's marketing activity over the last six months
For the six months from February 2026 to the capture date, here is everything we could count.
| LinkedIn organic | 11.4 posts per week (measured over a 41-day window) |
|---|---|
| LinkedIn paid | 245 new creatives; 63–105 live in any month |
| Google paid | 51 new creatives |
| 16 posts in this window; 18 since the account opened in January 2026 | |
| YouTube | 2 videos, 462 minutes — both Clay Cup broadcasts |
| X (main account) | Not retrievable via any endpoint we tried |
| TikTok, Threads | None found |
Instagram has the most extreme engagement outlier in the dataset. Across the account's 18 posts, the median is 34.5 reactions. One creator collaboration received 108,715 reactions and 1,840,835 plays, more than three thousand times the median reaction count. Its caption reads "Maybe if I was using @claygtm like the rest of the team, we wouldn't be having this issue," with the tag #claypartner. The collaboration accounts for a very different level of reach from the account's typical post. An average would obscure that difference, making the whole account appear to perform like its exceptional hit.
We also checked the transition between Clay's X accounts. The older account, @clay_gtm, now called Clay University, contains activity from December 2018 through September 17, 2025, when it posted "We're launching a new account!!" The destination account returned "account doesn't exist" from every endpoint we tried. That leaves roughly eleven months unavailable through this collection method; it should not be read as evidence that Clay stopped posting on X.
Product examples and education recur across Clay's channels
Across the channels, Clay repeatedly gives people a sample of the work its product can help them do. Sometimes that is a finished answer, such as a company's funding history. Elsewhere it is a lesson, a customer example or a live session in which someone explains a workflow. Product announcements and humor sit alongside this material, but publishing useful outputs and teaching their use are recurring features of the operation.
| Programmatic pages (15,173) | Publish the product output — enrichment answers, one page per company |
|---|---|
| YouTube (163 videos) | Teach the work — numbered lessons, named frameworks, creator-format demand content |
| LinkedIn ads (440) | Fill the classroom — dated workshops and launch streams, 52% of creatives |
| LinkedIn organic (67 in 41 days) | Hold the room — jokes for reach, dense launch posts for substance, almost no outbound links |
| Blog (238) | Maintain the evergreen library — 64% of sampled titles carry a year |
| Google ads (118) | The exception — a straight database pitch to people already shopping |
The Google ads place more emphasis on the availability and scale of Clay's data. That fits a searcher evaluating a specific tool or category, whereas a workshop gives Clay more room to demonstrate an application. Neither approach needs to serve every audience in every situation. What stands out is how consistently the formats reflect the question a prospective user is likely to have at that point.
This makes the community story more tangible. The visible support for it includes a YouTube course, a university subdomain and a workshop calendar promoted by more than half of LinkedIn ad creatives. People have recurring opportunities to learn something, see how others work and return for another session. Alongside that teaching effort, the largest website directory offers answers to specific company questions at a scale of more than ten thousand pages.
What marketing teams can learn from Clay
For another marketing team, the useful question is which parts of this approach fit its own product and audience. The following practices are visible in Clay's work and can be evaluated without trying to reproduce its scale.
Look for useful product outputs you can publish. Clay's /dossier directory accumulated most of its archived pages in about ten months, with each page answering a question about a company. For a product that generates useful data, a similar opportunity might be a searchable answer, a reference page or a worked example. The starting point is the customer's question and whether the output answers it well. A template and a reliable data source can then make repeated publishing practical.
Adapt the message to the situation in which someone sees it. Clay's Google text names no customers and emphasizes data supply, while its LinkedIn ads frequently name customers and invite people to workshops. For your own campaigns, ask what the audience already knows and what would help them take the next step. A person comparing vendors may need a direct explanation of coverage or capabilities; someone encountering the problem for the first time may benefit more from seeing a use case.
Plan the experience behind the ad. More than half of Clay's LinkedIn creatives promote a dated live session. That requires a subject worth teaching, someone to teach it and a session that delivers on the invitation. The calendar supplies new reasons to advertise, but also commits the team to producing the underlying experience. If you adopt this approach, the workshop plan and the advertising plan need to be developed together.
Give different kinds of posts a clear role. Clay publishes humor alongside substantial product updates, at 11.4 posts per week. That frequency creates many opportunities for both, but it does not establish a minimum cadence for being interesting. A team publishing twice a week can still vary its formats. The practical question is whether the feed, taken as a whole, gives readers a reason to follow and enough information to understand the product.
Consider paid distribution when planning organic content. With 345 of Clay's 440 LinkedIn creatives appearing as sponsored status updates, much of its advertising uses the same material as its feed. Planning the two together allows a team to consider which posts deserve wider distribution and whether they will make sense to people who do not already follow the company. It also makes it important to distinguish total engagement from organic performance when reviewing results.
Review a channel's purpose before judging its frequency. Clay's YouTube activity changed from frequent short lessons to occasional long broadcasts, while its university property expanded. A channel review should account for that change in format and where the earlier work now appears. Publishing fewer videos can be a deliberate choice about the audience experience; the count alone cannot tell you whether a channel needs more attention.
Clay's marketing becomes easier to understand when these choices are viewed together. The website answers specific questions, lessons help people learn the work, workshops provide recurring occasions to participate, and advertising brings those offers to different audiences. For a team studying Clay, those concrete publishing decisions offer a more useful starting point than trying to copy the outward appearance of its community.
How we did this research
Ampere, the AI marketing agent, collected material across nine surfaces using Ampere Platform's market and competitive intelligence tools: clay.com and its archive record, the blog, LinkedIn organic, LinkedIn paid, Google paid, YouTube, Instagram, X, and a check for TikTok and Threads accounts. Page content came from a deterministic stratified sample of 186 pages across eight directories, and video content from transcripts of 158 of the 163 uploads. Collection took about two hours.
The raw responses were saved unmodified, and every figure was computed from those files by a script, giving each number a traceable source in an API response. Message percentages use keyword rules applied to the full corpus. An ad counts as an event invitation when it matches terms such as live, workshop, webinar, register or join us. Customer references are matches against fifteen companies Clay publicly cites. These classifications measure observable wording; the interpretations of why that wording differs between channels are our analysis.
Verification included checking blog dates against the archive and reconstructing YouTube's history across three separate playlists. Reconciling those sources took longer than collection itself, but resolved two important ambiguities: updated articles that appeared to be newly published, and live broadcasts missing from the Videos tab.
The audit measures activity and messages, rather than spend, conversion, pipeline or revenue attribution. Public sources do not disclose Clay's advertising spend; intelligence vendors' panel-based estimates are described in their own documentation as directional. Creative volume is not a substitute for that information, since many inexpensive variants or a few heavily funded ads can produce very different totals. The counts, formats, first-appearance dates and copy are directly observable.
Coverage also excludes founders' personal LinkedIn feeds, company-page activity before the API's June 24, 2026 cutoff, and the inaccessible current X account. LinkedIn engagement includes any paid amplification that the public totals do not separate.
All figures captured 2026-08-03 from public sources: clay.com sitemap and pages, Internet Archive CDX, LinkedIn company and Ad Library APIs, Google Ads Transparency Center, YouTube, Instagram and X. Funding and valuation figures are from public reporting of Clay's August 2025 Series C and January 2026 tender offer. Clay's own statements are quoted from clay.com.